Keppel Stock Technicals: Drops 4.81% on Thursday, RSI Oversold
On October 8, 2026: price 10.49 SGD, trend downtrend, RSI 29.1, support 10.49, resistance 11.47. technical analysis of keppel stock. Keppel Stock Technicals —…
Trend & Price Action
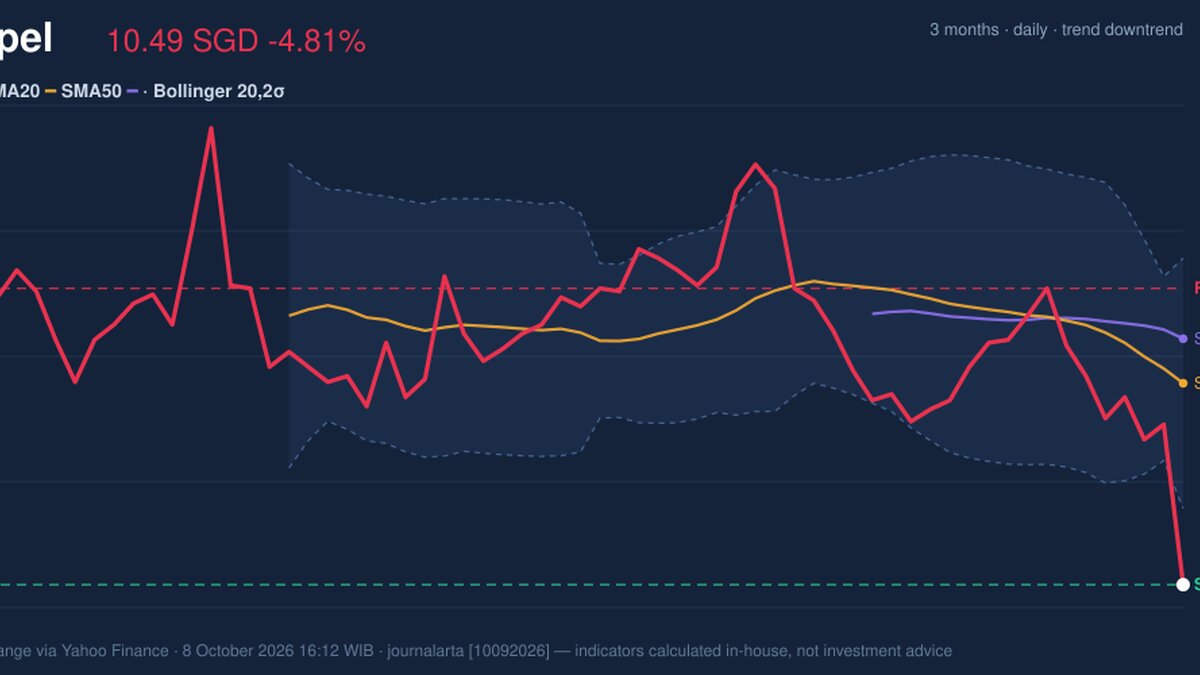
The decline extends Keppel’s weakness: the stock lost 6.17% over five trading days and 8.54% over one month. At S$10.49, it trades below its SMA20 of S$11.16 and SMA50 of S$11.30. The 20-day average is falling, down 1.70% over five days, while no new moving-average crossover has formed. In plain terms, the price trend is negative, and there is no crossover signal yet to suggest that it has turned. The stock is at the lower edge of its 20-day range, with support at S$10.49 and resistance at S$11.47. Its three-month low is S$10.45, just below the latest price, while the three-month high is S$12.04. The proximity to the low highlights how far the shares have retreated; it does not, on its own, establish that the decline has ended. As shown in the chart, the price sits below both moving averages and beneath the lower Bollinger Band, a combination that captures the strain on the short-term trend.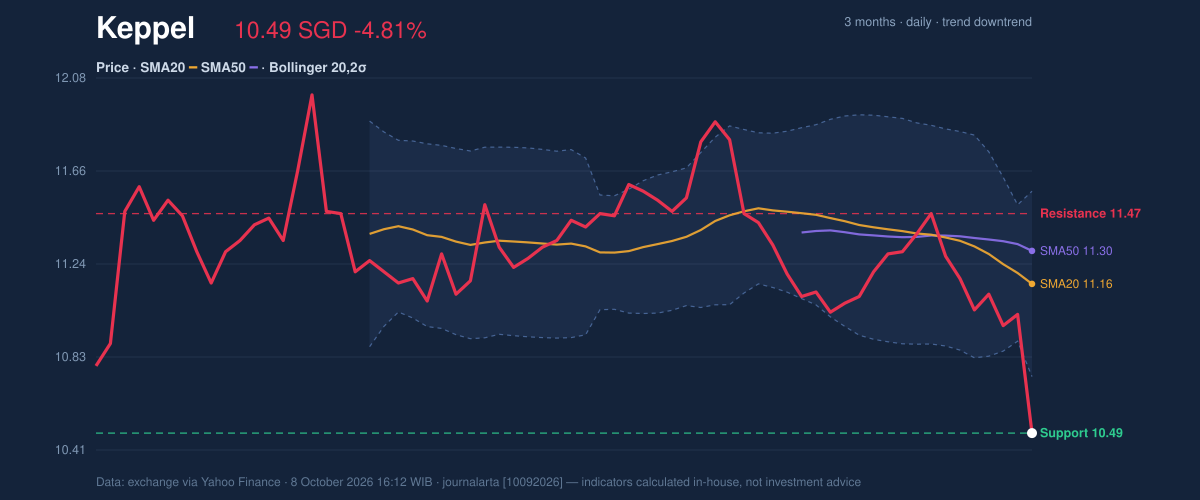
Oscillators & Momentum
Momentum indicators reinforce the weakness but also show how extended the decline has become. The RSI is 29.1, below the commonly watched 30 threshold, while the Stochastic is deeply oversold, with %K at 3.7 and %D at 16.7. These readings describe strong recent selling; they are not proof of an imminent rebound. In a persistent downtrend, oversold conditions can last. The MACD is negative at -0.128, below its -0.068 signal line, and its histogram is also negative at -0.060. That alignment indicates downside momentum remains in control, rather than confirming a reversal. The contrast is important: RSI and Stochastic flag an unusually stretched decline, but MACD still points lower.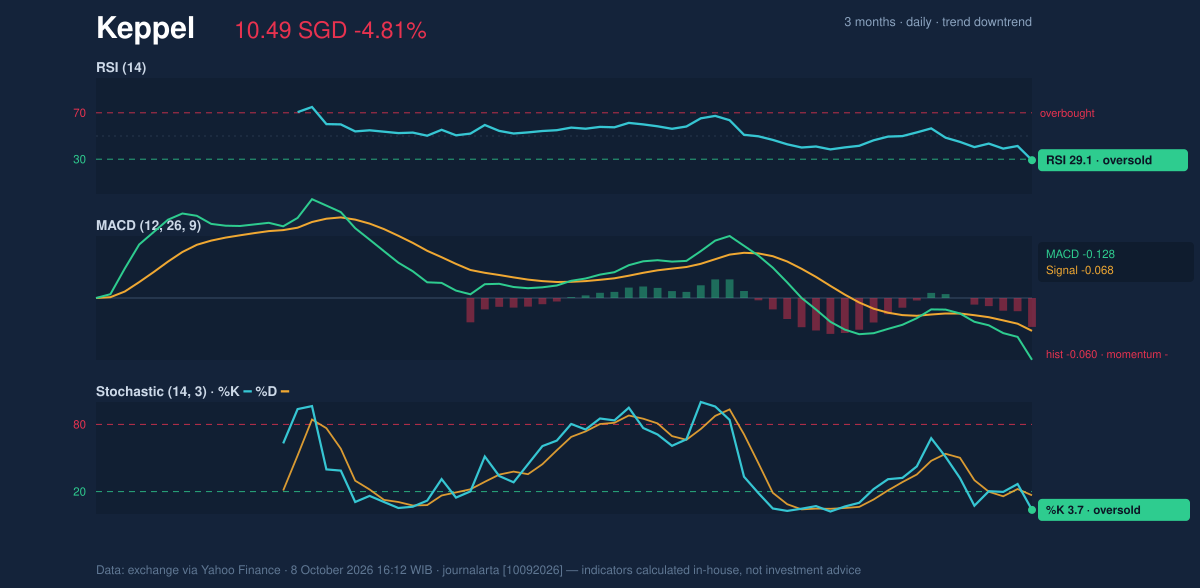
Volatility, Volume & Levels
Keppel’s Bollinger Band width is 7.4% and narrowing, a squeeze that can precede a larger price move but does not identify its direction. The latest price is below the band’s S$10.74 lower boundary, with %B at -30%. That position signals pressure beyond the usual band range, while the average true range of S$0.22, or 2.1% of the share price, indicates moderate volatility. Turnover adds weight to the day’s fall: 8,803,050 shares traded, compared with a 20-day average of 4,227,184. Higher volume during a decline suggests greater participation in the selling, and falling on-balance volume points in the same direction. Together, those measures weaken the case that the oversold readings alone mark a durable floor. A hold above S$10.45, the three-month low, would leave room for the price to stabilize near current levels. A break below that level would put the stock beneath its recorded three-month range and invalidate a cautious hold view. On the recovery side, S$10.74—the lower Bollinger Band—and then S$11.16, the SMA20, are reference points; reclaiming them would be needed to ease the immediate technical pressure. The chart shows these price levels alongside the moving averages and bands.Technical Verdict: HOLD (wait & see)
The technical picture is mixed, but it still leans weak: - The declining SMA20 and price below both the SMA20 and SMA50 confirm a downtrend. - Negative MACD, falling OBV and above-average volume on the decline indicate selling pressure remains active. - Oversold RSI and Stochastic, together with the share price near its three-month low, raise the possibility of a pause but do not confirm a reversal. The HOLD (wait & see) verdict is invalidated if Keppel falls below S$10.45. - Ideal entry range: S$10.45–S$10.74, around the three-month low and lower Bollinger Band. - Exit target: S$11.16–S$11.47, spanning the SMA20 and 20-day resistance. - Stop-loss protection: Below S$10.45. For non-traders, the indicators say Keppel is unusually oversold, but the downtrend has not yet shown a clear sign of ending.Data: SGX via Yahoo Finance, 8 October 2026, 16:12 WIB. This is technical analysis, not an investment recommendation.
Why Keppel is in focus today
- One-day move of -4.81%, about 2.3× its average daily range (ATR)
- Volume at 2.1× the 20-day average
- Trading near its 3-month low (10.45)
- RSI(14) at 29.1 — oversold zone
- Breaking out of a Bollinger squeeze (band width 7.4%)
- Downtrend extending (5-day change -6.17%)
- Not covered by JournalArta in the last 14 days
Selected automatically from 16 SGX (Singapore) stocks by a technical-signal score with daily weighted randomisation — not a recommendation.
Summary Data Keppel
| Last price | 10.49 SGD |
| Change 1 day / 5 days / 1 month | -4.81% / -6.17% / -8.54% |
| Trend / MA-cross | downtrend / none |
| SMA20 / SMA50 | 11.16 / 11.30 |
| RSI (14) / Stochastic %K | 29.1 / 3.7 |
| Bollinger %B / ATR | -30% / 0.22 |
| Support / Resistance 20 days | 10.49 / 11.47 |
| Data as of | 8 October 2026 16:12 WIB |
Disclaimer: This technical analysis is generated automatically from exchange data (via Yahoo Finance) and indicators calculated by JournalArta, for information and education only. The verdict and the entry, target and stop-loss levels are not investment advice or a solicitation to buy or sell any security. Investment decisions and their risks rest solely with the reader.
Track Keppel share price daily: live levels, support/resistance and our full Keppel analysis history.