DBS Stock Analysis: Gains 0.21%, Testing Key Resistance
On Agustus 24, 2026: price 76.00 SGD, trend uptrend, RSI 60.7, support 73.55, resistance 76.99. technical analysis of dbs stock. DBS Stock Analysis — full…
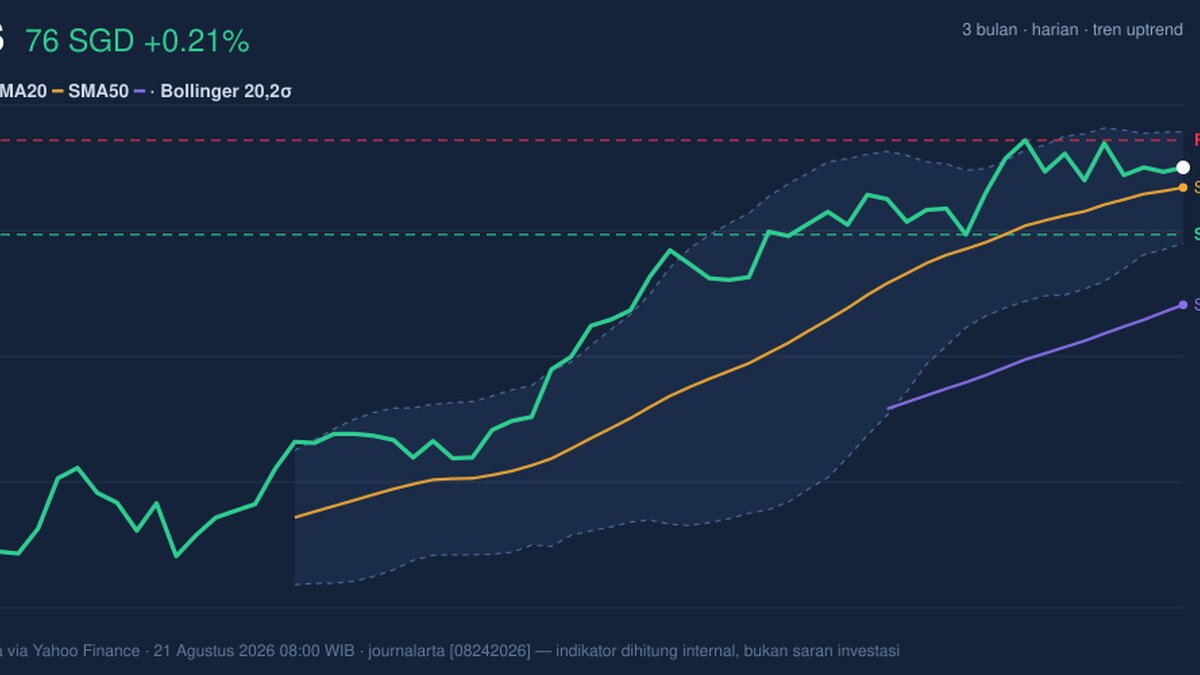
DBS Group’s shares were last at 76.00 SGD on SGX on 21 August 2026, edging up 0.21% from the previous close of 75.84. The move keeps the stock in a short-term uptrend, with price sitting above the SMA20 at 75.27 and far above the SMA50 at 70.99, a setup that still favours the longer trend. But the day’s action also shows a more cautious message beneath the surface: momentum is no longer fully aligned, and trading is happening with lighter participation than usual.
Trend & Price Action
As shown in the chart, DBS remains in constructive territory, but it is no longer moving with the same ease as earlier in the advance. The stock is trading above the SMA20, which means the near-term trend is still intact, while the gap to the SMA50 suggests the broader structure remains supportive. The absence of a fresh MA-cross matters here: there is no new trend ignition signal, just continuation. That usually signals a market that is holding gains rather than accelerating them.
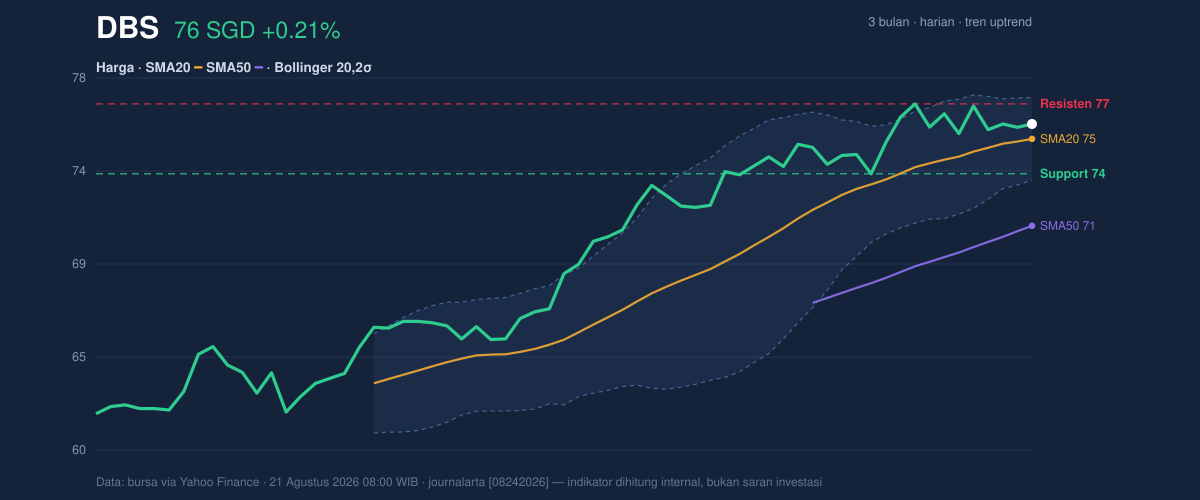
The price is also positioned at 71% of its recent range, with support at 73.55 and resistance at 76.99. In plain terms, DBS is closer to the upper end of its short-term band than the lower end, which tells traders the market is still willing to pay up — but only just below the next ceiling. The 3-month high at 77.97 is close enough to matter: it marks the area where the stock has recently struggled to extend.
That proximity is important.
A stock near resistance can still be strong — but it needs fresh demand to keep climbing.
Oscillators & Momentum
The momentum picture is more mixed, and that is where the chart becomes more informative. The RSI at 60.7 is neutral-to-firm, which usually means the stock is not overextended and still has room to move without immediately looking stretched. The Stochastic at 57.3 / 56.1 is also neutral, reinforcing the idea that DBS is neither oversold nor in a classic breakout sprint. In other words, the oscillators are not flashing danger — but they are not confirming strong upside acceleration either.
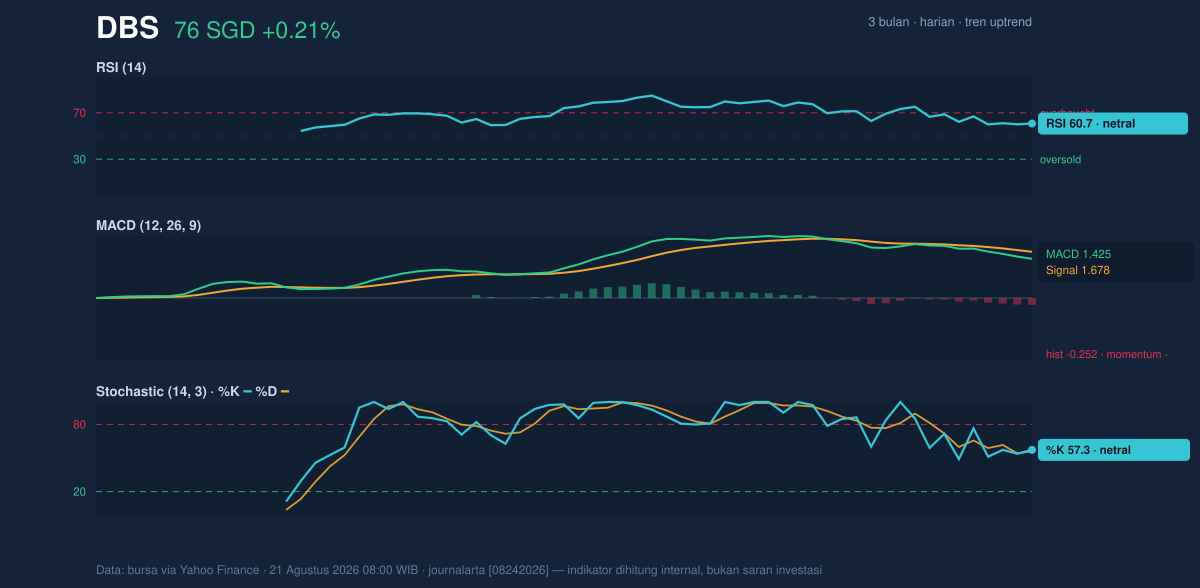
The more notable signal is the MACD at 1.425 versus signal 1.678, with a histogram of -0.252. That negative histogram means the shorter-term momentum has slipped below the slower trend line, a common sign that the advance is losing some thrust even while price remains elevated. This is not a bearish collapse signal on its own; rather, it is a warning that the stock may need a pause, consolidation, or a fresh catalyst before it can convincingly clear resistance.
In simple terms: price is still rising, but momentum is taking a breath.
Volatility & Volume
The volatility setup is notable because it points to compression rather than expansion. DBS’s Bollinger Bands are relatively tight, with the upper band at 77.30, the middle at 75.27, and the lower at 73.23. The 5.4% band width is described as a squeeze, which often means the stock is building pressure for a larger move. A squeeze does not predict direction, but it does increase the odds that the next meaningful move could be sharper than the recent drift.
The current %B at 68% shows price leaning into the upper half of the band range, which is consistent with a mildly bullish stance but not a runaway one. Meanwhile, ATR(14) at 1.31 — about 1.7% of price — suggests volatility is moderate, not explosive. That combination matters: compressed bands plus moderate ATR often mean the market is waiting for a trigger rather than already in a trend climax.
Volume adds a cautionary note. Last traded volume was 3,367,900, below the 20-day average of 4,649,504, or about 0.7× normal. That means the latest rise is not being backed by unusually heavy participation. However, OBV is rising, which indicates the cumulative flow of volume has still been improving over time. Put together, the message is subtle: buyers have not disappeared, but they are not yet pressing aggressively enough to confirm a breakout.
Key Levels & Scenarios
The near-term map is clear. 76.99 is the immediate resistance to watch, and the 77.30 Bollinger upper band sits just above it, which makes that zone a natural test area. If DBS can move through that pocket, the chart would start to look more like a genuine expansion from the current squeeze. On the downside, 75.27 is the SMA20 and middle Bollinger line, making it an important pivot. Below that, 73.55 is the key support from the 20-hour range and lines up closely with the 73.23 Bollinger lower band.
This is the market’s hinge point.
Above resistance, the squeeze can release. Below support, the tone changes quickly.
Technical Verdict: HOLD (wait & see)
HOLD (wait & see)
- Price trend is still positive: DBS is above the SMA20 and well above the SMA50, so the broader structure remains constructive.
- Momentum is not fully confirming: the MACD histogram is negative, while RSI and Stochastic are neutral, suggesting the advance is steady rather than forceful.
- Volatility is compressed: the Bollinger squeeze points to a possible expansion, but direction is not yet confirmed.
- Verdict invalidated if price falls below 73.55, which would mean short-term support has given way.
- Ideal Entry Range: 75.27 to 73.55
- Exit Target (Target Price): 76.99 to 77.30
- Stop Loss protection: below 73.55
For non-traders, this means DBS still looks steady, but the chart is waiting for proof before it shows its hand.
“The stock is holding its shape, but the next move still needs to earn its keep.”
Summary Data DBS
| Last price | 76.00 SGD |
| Change 1 day / 5 days / 1 month | 0.21% / 0.62% / 3.40% |
| Trend / MA-cross | uptrend / none |
| SMA20 / SMA50 | 75.27 / 70.99 |
| RSI (14) / Stochastic %K | 60.7 / 57.3 |
| Bollinger %B / ATR | 68% / 1.31 |
| Support / Resistance 20 days | 73.55 / 76.99 |
| Data as of | 21 Agustus 2026 08:00 WIB |
Track DBS share price daily: live levels, support/resistance and our full DBS analysis history.