HSBC Stock Gains 1.62%, Momentum Weakens In Focus
On Agustus 24, 2026: price 162.90 HKD, trend sideways, RSI 56.2, support 160.10, resistance 168.20. technical analysis of hsbc stock. HSBC Stock Gains — full…
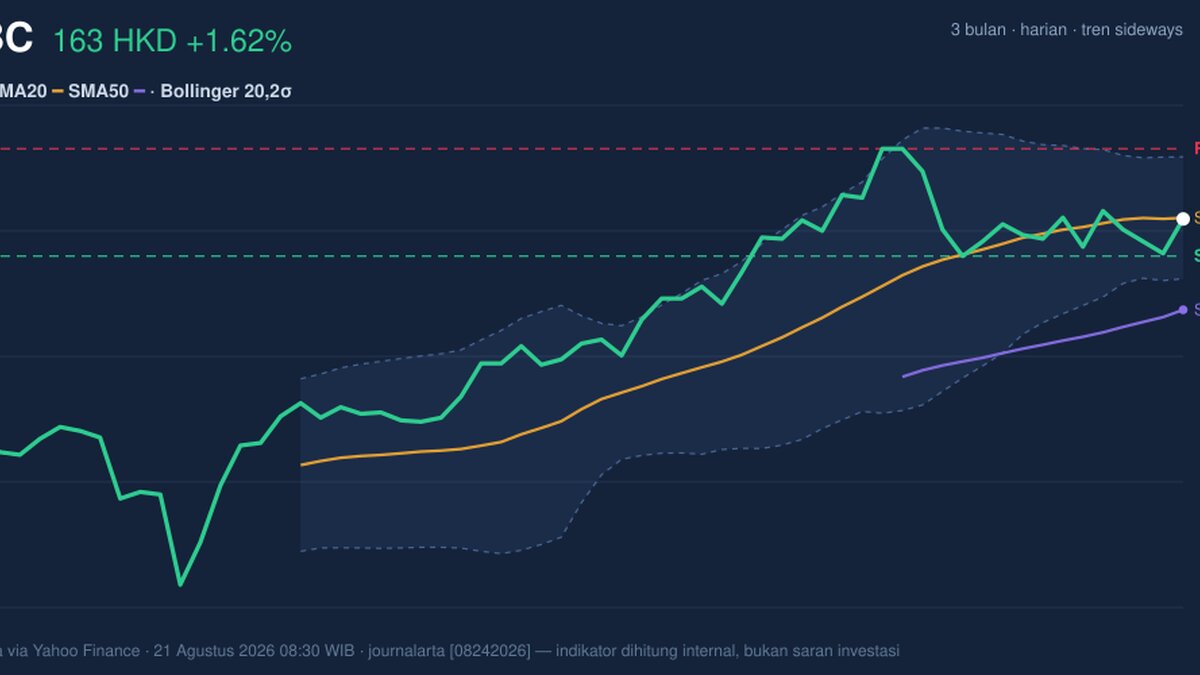
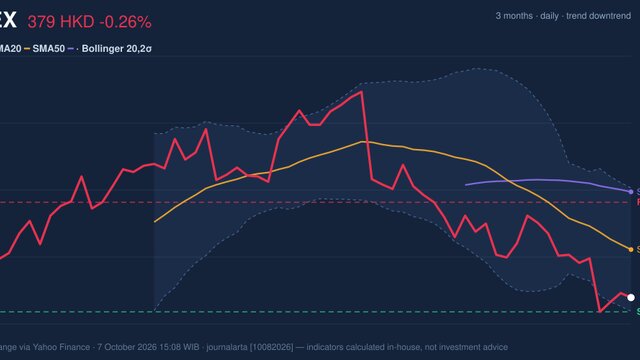
HSBC Holdings closed at 162.90 HKD on HKEX, up 1.62% from the previous close of 160.30, but the more important signal is that the share price is still sitting below its SMA20 at 162.98 while remaining well above the SMA50 at 156.04. That combination points to a market that is not trending decisively in either direction: short-term buyers have not fully regained control, yet the broader medium-term structure has not broken down. As shown in the chart, the stock is trading in the upper half of its recent range, but not at a breakout point.
Trend & Price Action
The price structure is best described as a sideways consolidation with a mild upward lean. The SMA20 slope of 0.43% over 5 days suggests the short-term average is still rising, which usually means the market is trying to build a firmer base. But because the share price remains below the SMA20, that effort has not yet translated into a clean trend confirmation. In practical terms, the market is hovering near the balance point between demand and supply rather than committing to a direction.
The broader context is constructive but not decisive. HSBC is trading far above the 3-month low of 133.50 and still below the 3-month high of 169.70, which places the stock in the upper part of its longer trading band without reaching the ceiling. That positioning matters: it shows investors have already re-rated the stock from the lows, but the market is now pausing to decide whether the move has enough follow-through.
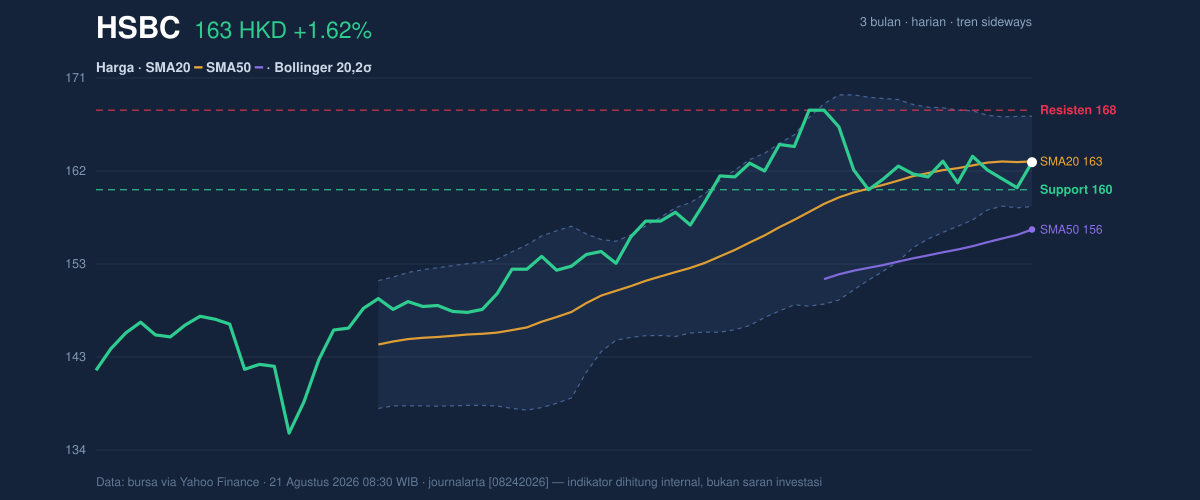
The key detail in the chart is the compression of price around the middle Bollinger band. That often means the market is waiting for a catalyst rather than pricing in a strong move immediately.
Oscillators & Momentum
Momentum is mixed, and that is the clearest reason this name is not yet in a strong directional phase. The RSI at 56.2 is neutral-to-firm, which means the stock is not overbought and still has room to advance if buyers step in. The Stochastic %K at 44.3 and %D at 32.5 also sit in neutral territory, with %K above %D, a modestly positive short-term sign. In plain language, the faster momentum line is ahead of the slower line, but only by a limited margin.
The problem is the MACD at 1.402 versus the signal line at 2.051, leaving a negative histogram of -0.649. That tells a different story: the underlying move is losing force even though price has not collapsed. MACD is a trend-following indicator, so when it stays below the signal line, it often means the market is still digesting a prior move rather than extending it. As shown in the momentum chart, this is a classic “not weak enough to fall apart, not strong enough to accelerate” setup.
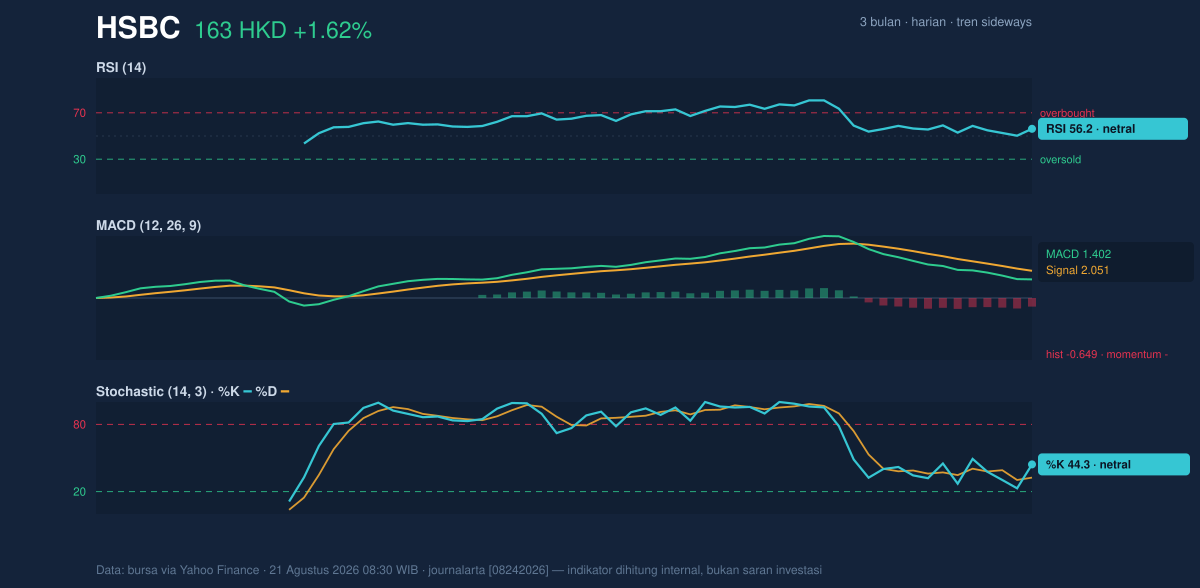
That split between neutral RSI/Stochastic and negative MACD is important. It usually means the market needs either a fresh burst of volume or a clean break of a nearby level before direction becomes clearer.
Volatility & Volume
Volatility is present, but not extreme. The ATR(14) at 2.71, or 1.7% of price, suggests a moderate daily swing range. That matters because it frames how far the stock can realistically move without a major news shock. The Bollinger Bands reinforce this view: the upper band is 167.59, the middle band is 162.98, and the lower band is 158.38. With %B at 49%, the price is almost exactly in the middle of the band structure, which is a neutral position. It is neither pressing the top band, which would indicate strength, nor leaning on the lower band, which would imply weakness.
The more interesting signal is the 5.6% Bollinger width, described as a squeeze. A squeeze means the bands have narrowed, often reflecting a period of compressed trading where a larger move can follow. It does not predict direction by itself, but it does warn that the current calm may not last.
Volume is not confirming a strong breakout. The latest volume of 11,360,351 is only 0.9× the 20-day average of 13,093,349, and OBV is falling. OBV, or on-balance volume, tracks whether volume is flowing into the stock or away from it. A declining OBV while price is holding up suggests buyers are present, but not aggressively enough to force a sustained advance. That is the kind of divergence traders watch closely: price may look stable, while participation quietly weakens.
Key Levels & Scenarios
The near-term map is straightforward. Support sits at 160.10, while resistance is 168.20. The stock is currently about 35% of the way through that range, which leaves room in both directions. If price can reclaim the SMA20 at 162.98 and then push through 168.20, the next area of interest is the upper Bollinger band at 167.59 and then the 3-month high at 169.70. If it fails to hold 160.10, the market would be testing whether the recent sideways base has lost support.
The setup is therefore less about immediate trend confirmation and more about whether the squeeze resolves with enough participation. Without stronger volume and a positive MACD turn, rallies may remain contained.
Technical Verdict: HOLD (wait & see)
HOLD (wait & see)
- MACD is still negative versus the signal line, showing momentum has not fully turned in favor of buyers.
- Price is below the SMA20, so the short-term trend has not yet reclaimed the key moving-average reference.
- Bollinger Bands are squeezed, which signals a possible breakout, but not yet a confirmed direction.
Verdict invalidated if price falls below 160.10, which would weaken the current range base and shift attention to the lower Bollinger band at 158.38.
- Ideal Entry Range: 160.10 to 162.98
- Exit Target (Target Price): 167.59 to 168.20
- Stop Loss protection: below 160.10, with additional caution under 158.38
For non-traders: HSBC is moving, but the chart still looks like a pause rather than a clear new trend.
Summary Data HSBC
| Last price | 162.90 HKD |
| Change 1 day / 5 days / 1 month | 1.62% / 1.31% / 0.93% |
| Trend / MA-cross | sideways / none |
| SMA20 / SMA50 | 162.98 / 156.04 |
| RSI (14) / Stochastic %K | 56.2 / 44.3 |
| Bollinger %B / ATR | 49% / 2.71 |
| Support / Resistance 20 days | 160.10 / 168.20 |
| Data as of | 21 Agustus 2026 08:30 WIB |
Track HSBC share price daily: live levels, support/resistance and our full HSBC analysis history.