Momentum Gains, Singtel Stock Drops 1.12% Today
On Agustus 24, 2026: price 4.40 SGD, trend sideways, RSI 48.8, support 4.25, resistance 4.61. technical analysis of singtel stock. Momentum Gains — full…
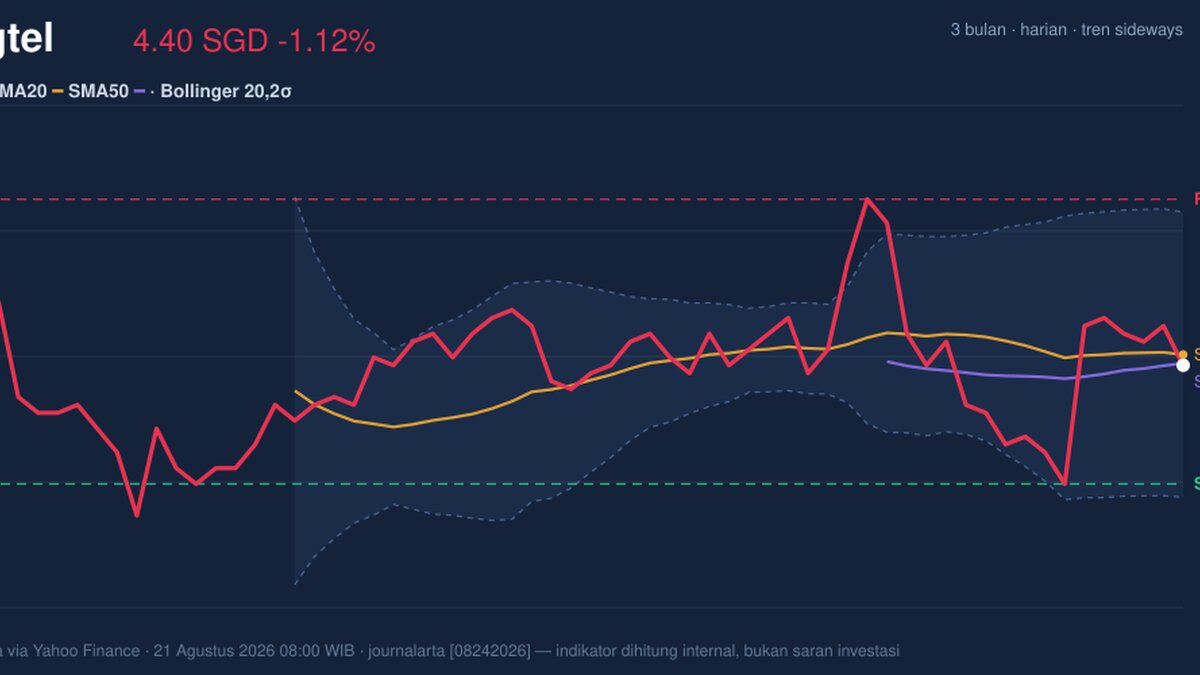
Singapore Telecom (Singtel) traded at SGD 4.40 on SGX on 21 August 2026, slipping 1.12% from the previous close of 4.45 as the stock stayed trapped in a narrow range rather than breaking into a fresh trend. The move matters less for its size than for what it says about conviction: the shares are hovering around the middle of their recent band, with neither buyers nor sellers showing enough force to seize control.
Trend & Price Action
As shown in the chart, Singtel is still in a sideways trend, and that is the key signal. The price sits just below SMA20 at 4.41 and essentially on top of SMA50 at 4.40, which tells traders the stock is balanced on a technical fault line rather than trending decisively higher or lower. A flat SMA20 slope of 0.02% over 5 days reinforces that message: recent movement has been too mild to establish direction.
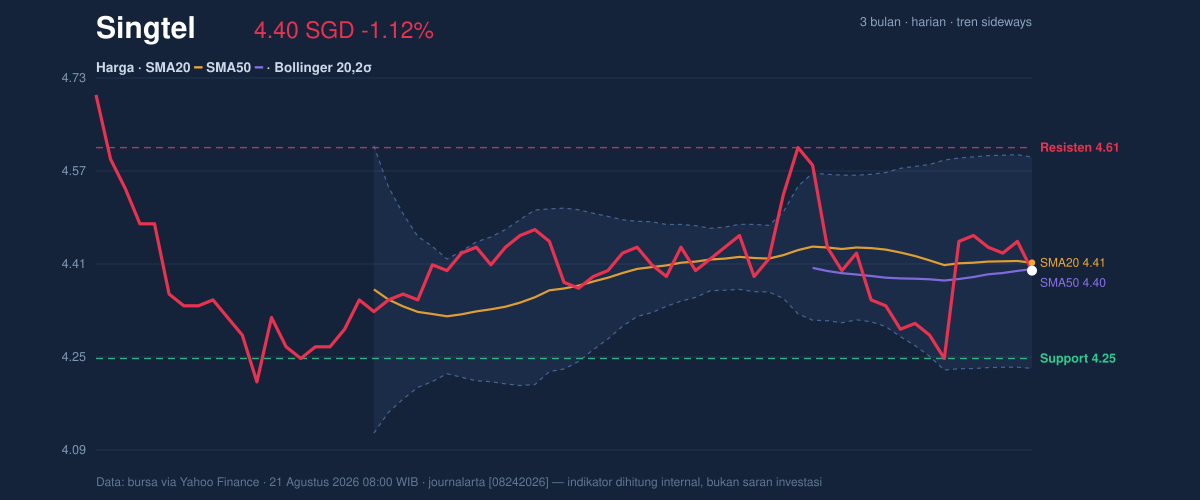
The lack of a fresh MA-cross also matters. In plain terms, there is no new moving-average crossover to suggest a momentum shift has just begun. That leaves the chart in a waiting pattern, where the market is watching whether the price can reclaim the short-term average or drift back toward the lower band. Within the 20-hour support at 4.25 and resistance at 4.61, the stock is sitting at about 42% of the range, which is closer to the lower half but not yet at the point where the chart would signal stress.
The broader context is mixed rather than weak. Singtel is still above the 3-month low of 4.15, but it remains well below the 3-month high of 5.02. That gap shows the market has not yet rebuilt the kind of enthusiasm needed to revisit the top of the range.
Oscillators & Momentum
The momentum tools are mostly neutral, but they are not empty. RSI at 48.8 is close to the midpoint, which means the stock is neither overbought nor oversold and has room to move in either direction. Stochastic %K at 72.4 and %D at 69.7 lean higher within neutral territory, suggesting short-term price pressure has improved, though not enough to call it a breakout signal on its own.
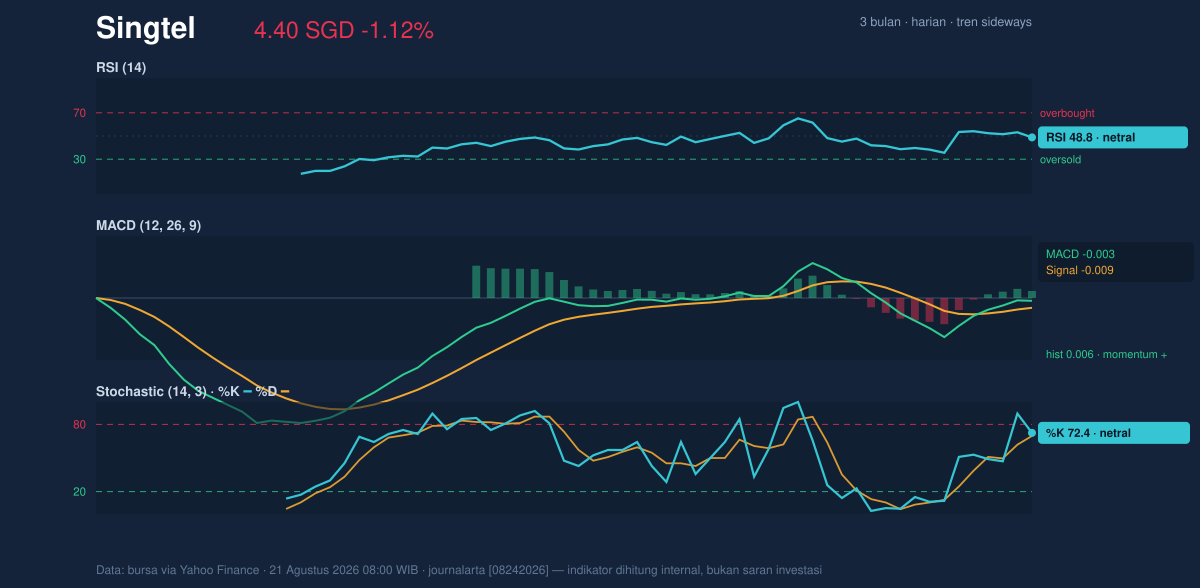
The more interesting reading comes from MACD at -0.003 versus signal at -0.009, with a positive histogram of 0.006. That combination usually means the stock’s downward momentum is fading and the shorter-term line is improving relative to the signal line. In other words, momentum is not strongly bullish, but it has turned a little more constructive than the price action alone would suggest. This is why the chart looks less bearish than the recent price drift might imply.
The tension between a neutral RSI and a slightly positive MACD histogram often appears when a stock is stabilizing after a soft patch. It does not guarantee a turn, but it does indicate that sellers are no longer pressing as hard as before.
Volatility & Volume
Bollinger Bands help define how much room the stock has to breathe. With the middle band at 4.41, the price at 4.40, and %B at 46%, Singtel is almost exactly at the center of its volatility envelope. That is a classic sign of balance, not urgency. The upper band at 4.59 and lower band at 4.23 frame the near-term trading corridor, while the 8.2% band width points to normal volatility rather than a squeeze that might precede a sharp move.
ATR at 0.08, or 1.9% of price, confirms that daily swings are moderate. That matters because it suggests any move through support or resistance is likely to be gradual rather than explosive unless volume expands. For now, the stock is not pricing in a dramatic event.
Volume is the clearest caution flag. Last volume of 18,475,200 was only 0.6x the 20-session average of 31,561,868, and OBV is falling. That combination says participation has been thin and the recent weakness has not been met by strong buying interest. When volume dries up during a sideways phase, price can drift without much resistance, but it also means any attempted rebound may lack the sponsorship needed to stick.
Key Levels & Scenarios
The chart’s most important levels are straightforward. Support at 4.25 is the first line that matters because it sits just above the lower Bollinger band at 4.23. If the price fails to hold that area, the market would be signaling that the recent range has broken down and that the 3-month low at 4.15 could come back into view. On the upside, resistance at 4.61 aligns closely with the upper Bollinger band at 4.59, so a move through that zone would indicate the stock has escaped the current neutral channel.
Because the price is near the center of the Bollinger range and the momentum readings are mixed, the most meaningful signal will be confirmation rather than anticipation. A sustained move above 4.41 would be a first sign that the stock is trying to reassert itself above the short-term average, while weakness below 4.25 would shift the tone from neutral to fragile.
Technical Verdict: HOLD (wait & see)
HOLD (wait & see) is the clearest reading because the chart is balanced, not decisive.
- RSI at 48.8 is neutral, so there is no strong overbought or oversold signal.
- MACD histogram at 0.006 is positive, but the price is still below SMA20 at 4.41, so momentum improvement has not yet been confirmed by price.
- Volume at 0.6x average and OBV falling argue against treating the latest move as a reliable breakout attempt.
- Verdict invalidated if price falls below 4.25.
- Ideal Entry Range: 4.25 to 4.41
- Exit Target: 4.59 to 4.61
- Stop Loss: below 4.23
In plain English: the stock is sitting in a narrow lane, and the next meaningful move should come only after it leaves that lane.
Last close: SGD 4.40.
Summary Data Singtel
| Last price | 4.40 SGD |
| Change 1 day / 5 days / 1 month | -1.12% / -1.12% / -1.35% |
| Trend / MA-cross | sideways / none |
| SMA20 / SMA50 | 4.41 / 4.40 |
| RSI (14) / Stochastic %K | 48.8 / 72.4 |
| Bollinger %B / ATR | 46% / 0.08 |
| Support / Resistance 20 days | 4.25 / 4.61 |
| Data as of | 21 Agustus 2026 08:00 WIB |
Track Singtel share price daily: live levels, support/resistance and our full Singtel analysis history.