Momentum Weakens, AIA Stock Gains 3.30% Today
On Agustus 24, 2026: price 75.15 HKD, trend sideways, RSI 51.3, support 70.40, resistance 79.65. technical analysis of aia stock. Momentum Weakens — full…
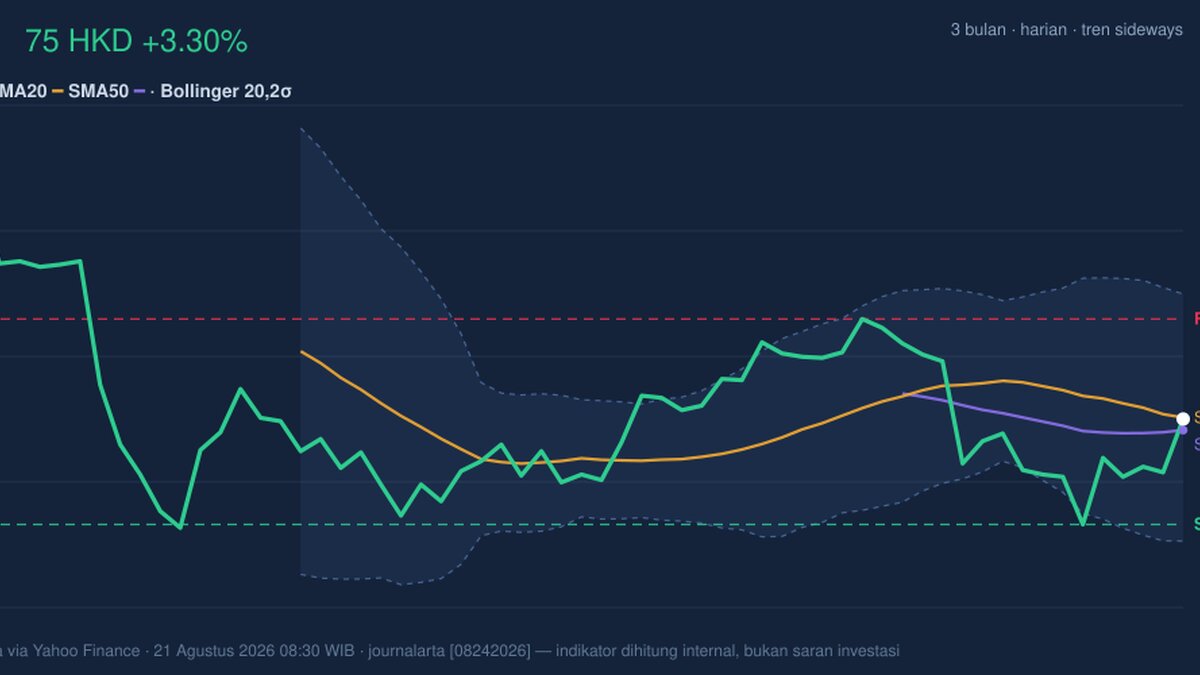
AIA Group edged up to 75.15 HKD in Hong Kong trading, a 3.30% rise on the day, but the move still leaves the insurer sitting just below its 20-day average of 75.22, a small but important detail that shows the stock has not yet reclaimed near-term trend control. As shown in the chart, the price is trading in the middle of its recent band rather than at an extreme, which usually signals a market that is waiting for a clearer catalyst rather than one already in a decisive breakout.
Trend & Price Action
The broader picture is best described as sideways, with the SMA20 slope down 1.28% over five days. That means the short-term trend is still leaning lower even though the latest session was firm. The stock is also below the SMA20 but above the SMA50 at 74.65, which is a classic mixed setup: the immediate trend is soft, while the medium-term base has not broken. In plain terms, AIA is not in a strong downtrend, but it also has not convincingly turned upward.
The absence of a fresh MA-cross matters. A new moving-average crossover often marks a trend change, and without one, the chart is telling investors that the recent bounce is still only a bounce. The price has also recovered only part of its recent weakness, with the stock down 3.78% over the past month despite gaining 6.75% over five days. That combination usually points to a market trying to stabilise after a softer stretch, rather than one in a clean advance.
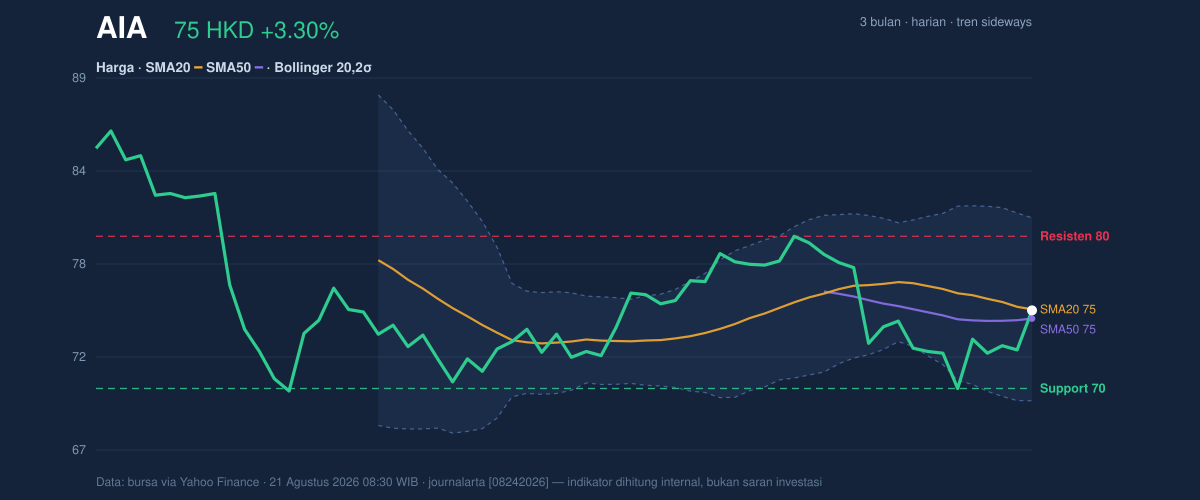
The position within the recent range is also informative. At 51% of the 20-hour range, the stock is almost exactly in the middle between 70.40 support and 79.65 resistance. That middle-ground location often reflects indecision. It suggests neither buyers nor sellers have fully seized control, and the next meaningful move is more likely to come from a break of one of those boundaries than from drift alone.
Oscillators & Momentum
Momentum indicators are mostly neutral, but not especially constructive. The RSI at 51.3 sits in the middle of the scale, which means the stock is neither overbought nor oversold. That is a useful sign because it leaves room for movement in either direction, but it also confirms the market is not showing strong enthusiasm yet. The Stochastic %K at 50.8 and %D at 35.2 is similarly balanced. Since %K is above %D, short-term momentum has improved, but the reading is still far from an overextended bullish signal.
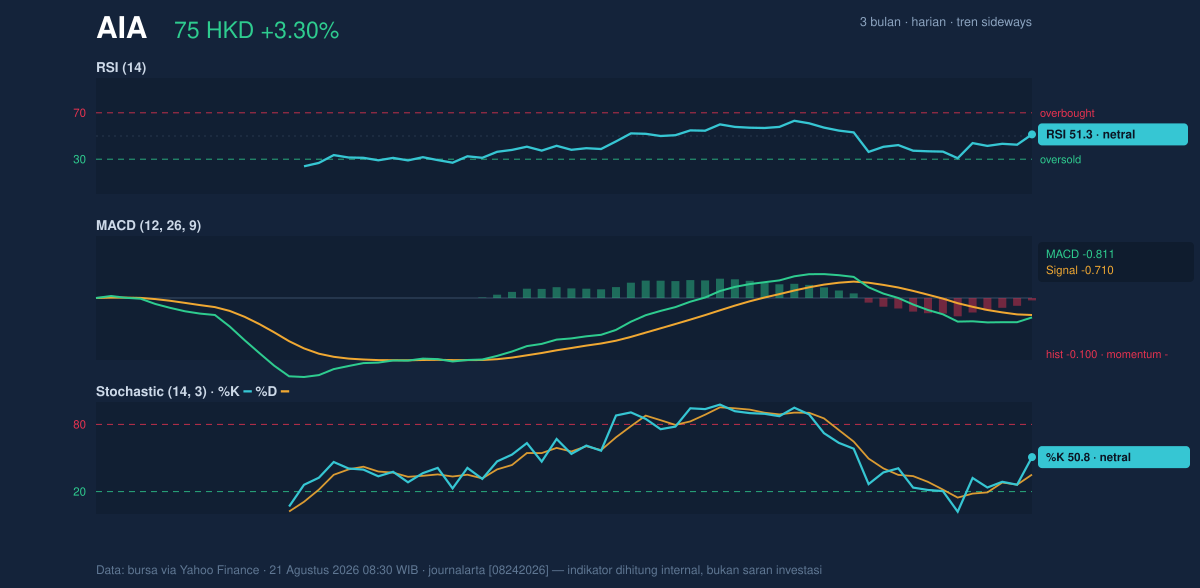
The more cautionary detail is the MACD at -0.811, still below its signal line at -0.710, with a histogram of -0.100. MACD is a trend-following momentum tool, and when it remains negative while price is hovering near the middle of the Bollinger band, it usually means upward attempts are not yet strong enough to flip the broader short-term bias. In other words, the stock has stopped falling aggressively, but it has not yet generated enough momentum to confirm a durable upside turn.
Volatility & Volume
Volatility is moderate, not stretched. The ATR(14) of 2.38, equal to 3.2% of price, indicates the stock is moving enough to matter but not enough to suggest panic or disorder. The Bollinger Bands are also telling. Price sits near the middle, with %B at 49%, while the band width of 14.8% is described as normal. That combination points to a market in a balanced state rather than one in compression ahead of a sharp move or expansion after a breakout.
Volume adds a slight note of support, but not a decisive one. The latest turnover of 37,549,323 was about 1.2× normal versus the 20-session average of 30,538,311. Higher volume on an up day can be constructive because it suggests more market participation. Yet the OBV is falling, and that weakens the message. OBV, or on-balance volume, tracks whether volume is accumulating on up days or being distributed on down days. A declining OBV while price stabilises often means the rally is not being broadly confirmed by money flow.
Key Levels & Scenarios
The chart’s key levels are clear. 70.40 is the nearest support, and 79.65 is the nearest resistance. Above that, the 80.78 upper Bollinger Band acts as a secondary barrier, while the 69.66 lower Bollinger Band marks the lower edge of the current volatility envelope. The broader three-month map shows a range between a 87.05 high and a 69.05 low, with the current price still closer to the lower half of that band than to the top.
If 79.65 gives way on sustained trade, the chart would start to look more constructive because price would be pushing through resistance, and the move would be supported by a firmer position above the Bollinger midline. If instead 70.40 fails, the market would be exposed to a retest of the lower Bollinger area near 69.66, which would imply that the recent rebound has lost traction.
Technical Verdict: HOLD (wait & see)
HOLD (wait & see) fits the current setup best because the stock is caught between a short-term down-leaning trend and a medium-term floor that has not broken. The main reasons are:
- Price is below SMA20 but above SMA50, showing mixed trend signals rather than a clean direction.
- MACD remains negative, so momentum has not yet confirmed a stronger upside turn.
- RSI and Stochastic are neutral, which supports stability but not conviction.
Verdict invalidated if price falls below 70.40, because that would break the nearest support and weaken the current range structure.
- Ideal Entry Range: 70.40 to 75.22
- Exit Target: 79.65 to 80.78
- Stop Loss Protection: below 69.66
In plain English, the chart says AIA is stabilising, but it has not yet proved that the rebound is strong enough to turn into a lasting move.
Summary Data AIA
| Last price | 75.15 HKD |
| Change 1 day / 5 days / 1 month | 3.30% / 6.75% / -3.78% |
| Trend / MA-cross | sideways / none |
| SMA20 / SMA50 | 75.22 / 74.65 |
| RSI (14) / Stochastic %K | 51.3 / 50.8 |
| Bollinger %B / ATR | 49% / 2.38 |
| Support / Resistance 20 days | 70.40 / 79.65 |
| Data as of | 21 Agustus 2026 08:30 WIB |
Track AIA share price daily: live levels, support/resistance and our full AIA analysis history.