Momentum Weakens, PANW Stock Gains 2.38% Today
On Agustus 24, 2026: price 357.87 USD, trend sideways, RSI 51.4, support 314.15, resistance 396.00. technical analysis of panw stock. Momentum Weakens — full…
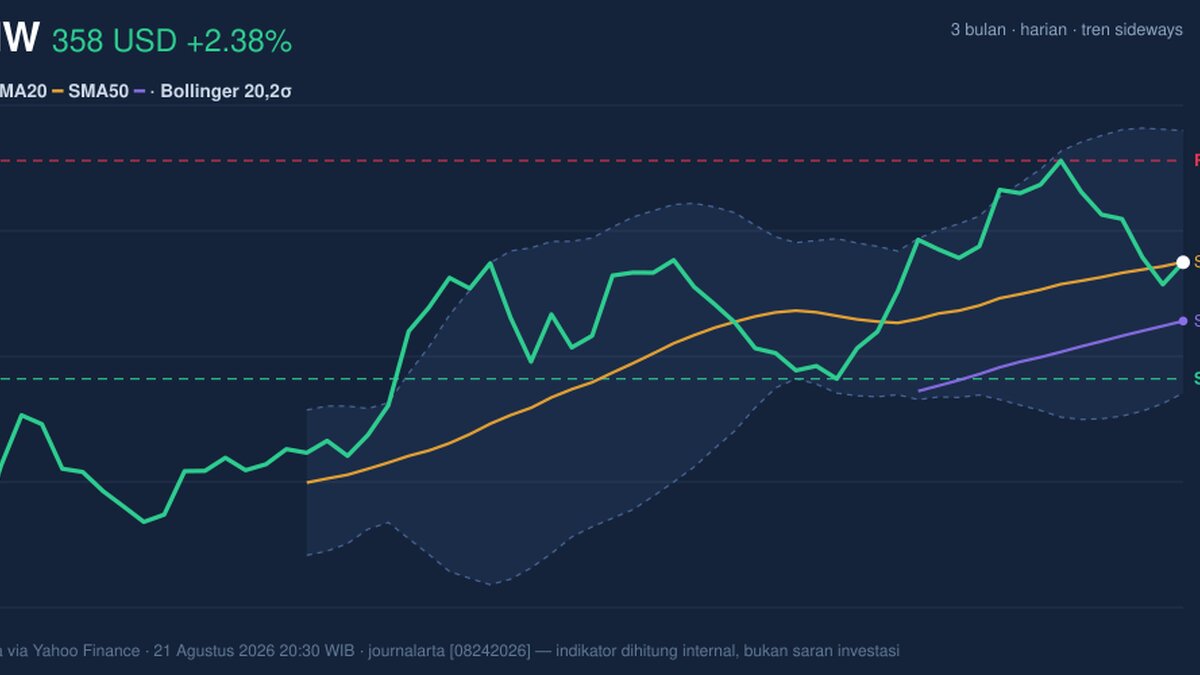
Palo Alto Networks slipped to 357.87 USD on Nasdaq, a move that leaves the cybersecurity group almost exactly on top of its SMA20 at 358.03 but still below the short-term average. The stock is not breaking out, and it is not breaking down either. That matters because the chart now sits in a narrow decision zone: the broader trend remains sideways, while the latest tape shows a market trying to absorb a recent 5-day drop of 6.87% even after a 1-month gain of 10.53%.
Trend & Price Action
The price structure is mixed, and the mix is the signal. PANW is trading below the SMA20 but well above the SMA50 at 335.84, which suggests the stock has not lost its medium-term base even though near-term momentum has cooled. With no fresh MA-cross, there is no new moving-average confirmation telling traders that the trend has decisively changed direction.
As shown in the chart, the stock is sitting near the middle of its Bollinger range, with %B at 50%. In plain language, that means PANW is neither stretched toward the upper band nor pressed against the lower band; it is positioned in the center of the recent trading envelope. The band width has expanded to 27.5%, which signals higher volatility. When Bollinger bands widen, the market is pricing in a larger potential swing, even if the current price looks calm on the surface.
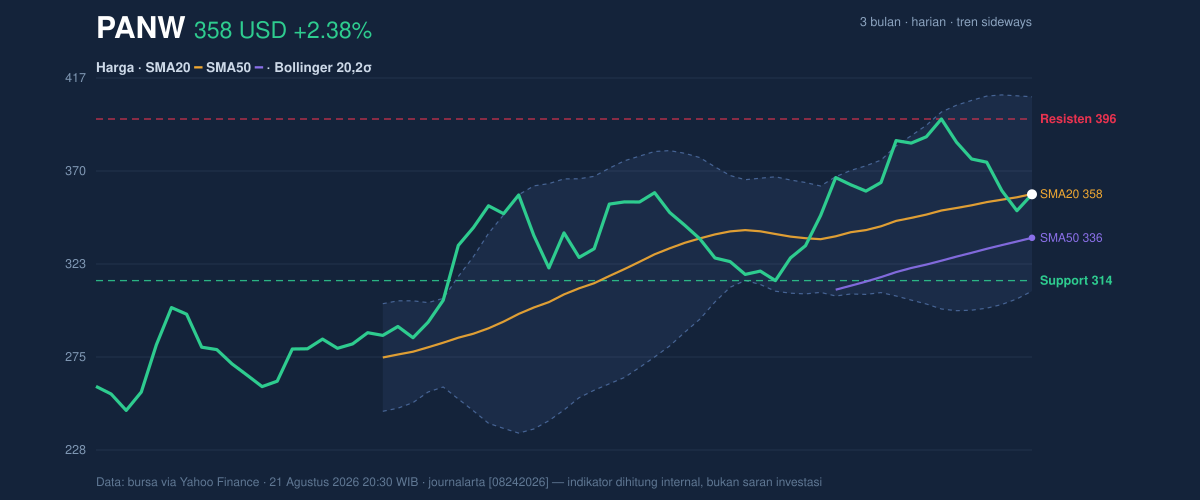
The broader range also helps frame the move. PANW is trading about halfway through its 20-hour support-resistance range from 314.15 to 396.00, and its 3-month high of 398.88 sits just above that resistance area. That means the stock is still below the part of the chart where buyers would need to prove they can push into fresh territory.
Oscillators & Momentum
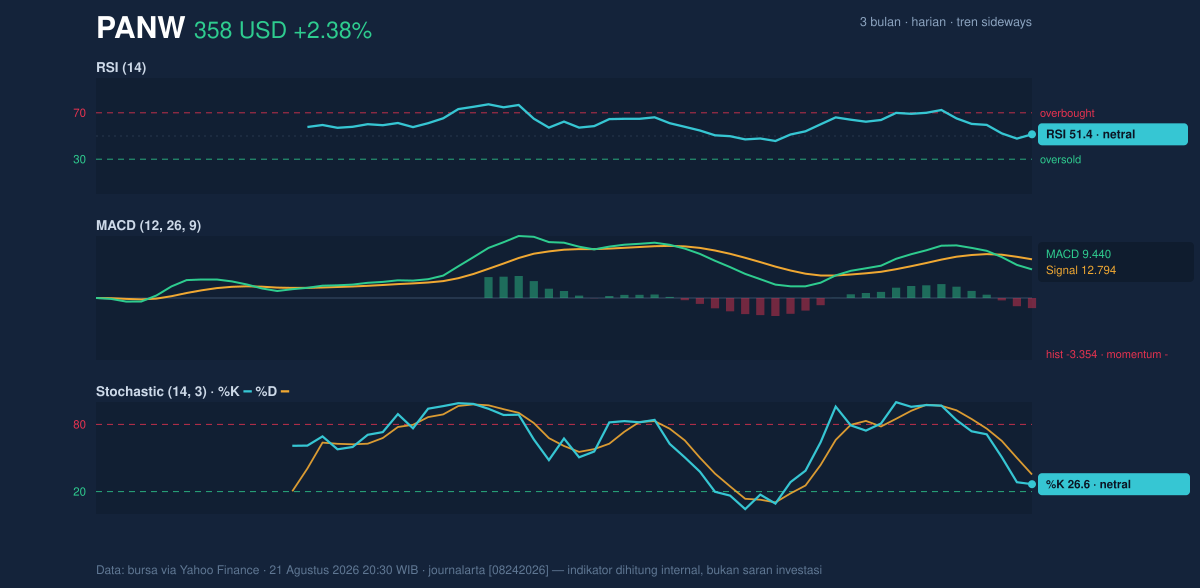
The momentum picture is less supportive than the price alone might suggest. RSI at 51.4 is neutral, which usually means neither buyers nor sellers have a dominant grip. That is not a bearish reading by itself, but it does show the stock has not built the kind of force that often accompanies a clean continuation move.
The Stochastic %K at 26.6 and %D at 35.2 points to a market that has cooled from stronger levels and is hovering near the lower part of its recent range without yet entering an extreme oversold condition. Stochastic is useful for spotting short-term turning points; here, it says the stock has lost some upward energy, but it has not fully washed out.
The more important warning comes from MACD. MACD at 9.440 sits below the signal line at 12.794, with a histogram of -3.354. That combination means recent price movement is weaker than the longer trend measure, a classic sign that upside momentum is fading. In simple terms, the stock can still hold its trend structure while the engine underneath runs a little less strongly.
Volatility & Volume
Volatility is elevated, but participation is not especially strong. ATR at 15.30, equal to 4.3% of price, indicates that daily swings are still meaningful. In a stock like PANW, that matters because a single session can cover a wide range without necessarily changing the bigger trend.
Volume, however, did not confirm the latest move. The stock traded 5,136,100 shares, below the 20-day average of 5,652,555, or about 0.9× normal. That suggests the latest price action was not powered by unusually strong conviction. When a stock moves on lighter-than-average volume, the move can be real, but it is often less persuasive than one backed by clear participation.
The OBV is falling, and that is a subtle but important clue. On-Balance Volume tracks whether volume is accumulating or leaving the stock over time. A declining OBV while price sits near the middle of its range usually means sellers have had the stronger cumulative influence, even if the price has not yet broken down. That divergence between a still-stable chart and weakening volume flow is why the current setup looks more like a pause than a strong advance.
Key Levels & Scenarios
The chart leaves a clear map. Support at 314.15 is the first level that matters if the stock loses its current balance. Below that, the price would be moving deeper into the lower half of the recent structure, which could invite a test of the broader base near the SMA50 at 335.84 from the other side if the market becomes unstable.
On the upside, resistance at 396.00 is the immediate ceiling to watch, with the 3-month high at 398.88 just above it. A move through that zone would not just be a number on the screen; it would mean PANW is reclaiming the upper edge of its recent range and challenging the area where prior momentum stalled.
The Bollinger framework adds context. Because the price is near the middle band at 358.03, a sustained move away from that center line would signal that the market is choosing a direction. If price pushes toward the upper band at 407.22, the market would be showing renewed strength. If it slips toward the lower band at 308.85, the chart would be telling a different story: volatility is expanding in the wrong direction.
Technical Verdict: HOLD (wait & see)
HOLD (wait & see)
- MACD is negative versus its signal line, which shows momentum is still weaker than the trend baseline.
- RSI is neutral and Stochastic is also neutral-to-soft, so there is no strong reversal confirmation yet.
- Price is sitting near SMA20 and mid-Bollinger, while OBV is falling and volume is below average, which argues for patience rather than commitment.
Verdict invalidated if price falls below 314.15.
- Ideal entry range: around 314.15 to 335.84
- Exit target: 396.00 to 398.88
- Stop loss protection: below 314.15
For non-traders: PANW is still holding its bigger base, but the chart needs stronger momentum and volume before it can be treated as more than a sideways pause.
“That is the market’s test now: either buyers prove they can reclaim the upper range, or the stock keeps drifting inside the box.”
Summary Data PANW
| Last price | 357.87 USD |
| Change 1 day / 5 days / 1 month | 2.38% / -6.87% / 10.53% |
| Trend / MA-cross | sideways / none |
| SMA20 / SMA50 | 358.03 / 335.84 |
| RSI (14) / Stochastic %K | 51.4 / 26.6 |
| Bollinger %B / ATR | 50% / 15.30 |
| Support / Resistance 20 days | 314.15 / 396.00 |
| Data as of | 21 Agustus 2026 20:30 WIB |
Track PANW stock price daily: live levels, support/resistance and our full PANW analysis history.