SBUX Stock Gains 2.97% Today, Testing Key Resistance
On Agustus 24, 2026: price 107.08 USD, trend uptrend, RSI 54.7, support 103.10, resistance 108.55. technical analysis of sbux stock. SBUX Stock Gains — full…
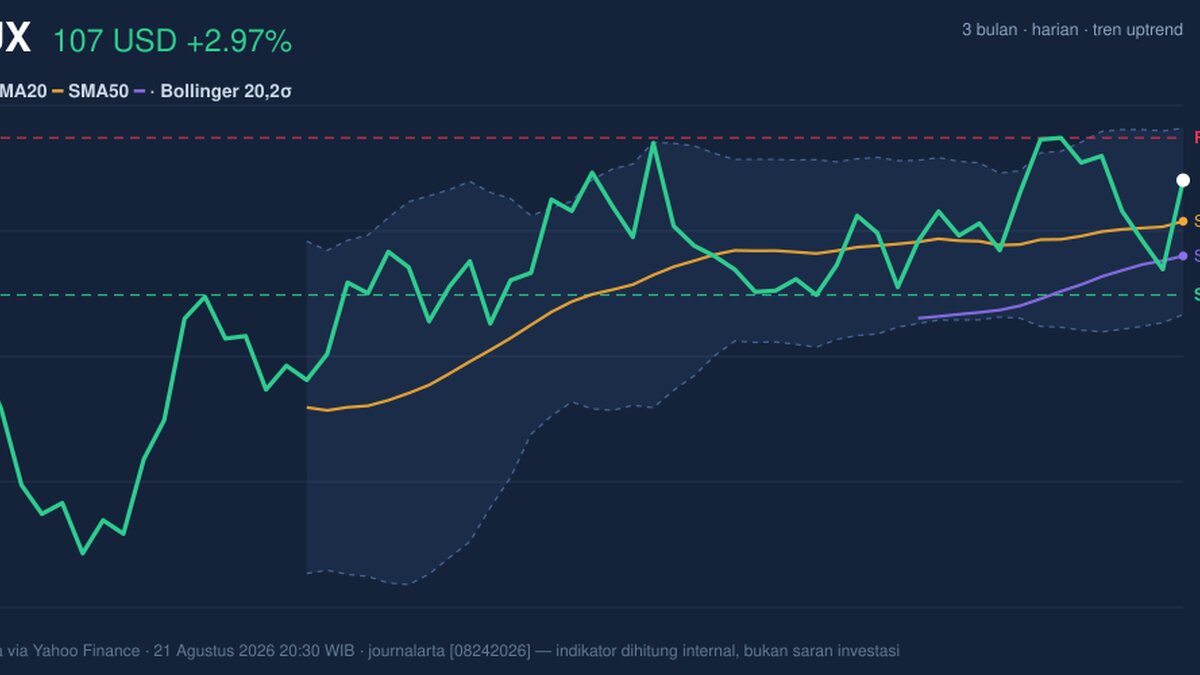
Starbucks Corp. traded at 107.08 USD on NASDAQ after rising 2.97% from the previous close, with the move taking the shares back into the upper half of their recent range. The stock is still in an uptrend, but the chart is sending a mixed message: price is above short- and medium-term averages, while momentum and volume are not fully confirming the advance.
Trend & Price Action
As shown in the chart, Starbucks is holding above both the SMA20 at 105.65 and the SMA50 at 104.45, which keeps the broader technical structure constructive. That matters because moving averages often act like a market’s memory: when price stays above them, recent buyers are still in control, and pullbacks tend to be treated as tests of demand rather than full trend breaks.
The slope of the SMA20, at 0.49% over 5 days, reinforces that near-term direction is still tilted upward. There is no new MA cross, so the stock is not flashing a fresh trend reversal signal; instead, it is extending an existing one. The current price sits at about 73% of the 20-hour range, which means SBUX is trading closer to the top than the bottom of its recent band, but not yet pressed against the ceiling.
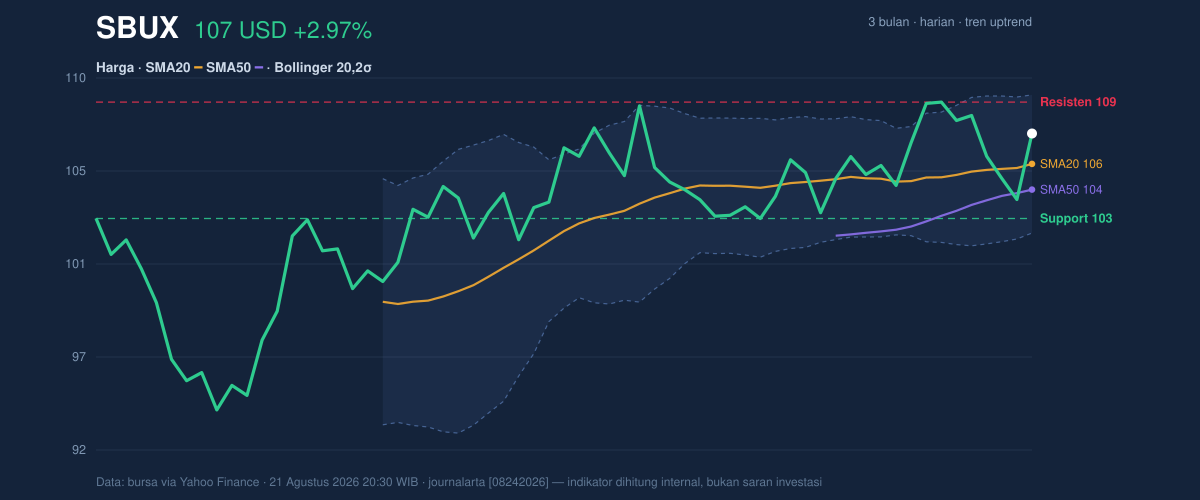
The key detail is that the stock is approaching the upper Bollinger band at 108.89 while still below the 3-month high of 110.51. That positioning suggests the market is probing resistance rather than breaking into uncharted territory. In plain terms, the shares are firm, but the next move needs confirmation.
Oscillators & Momentum
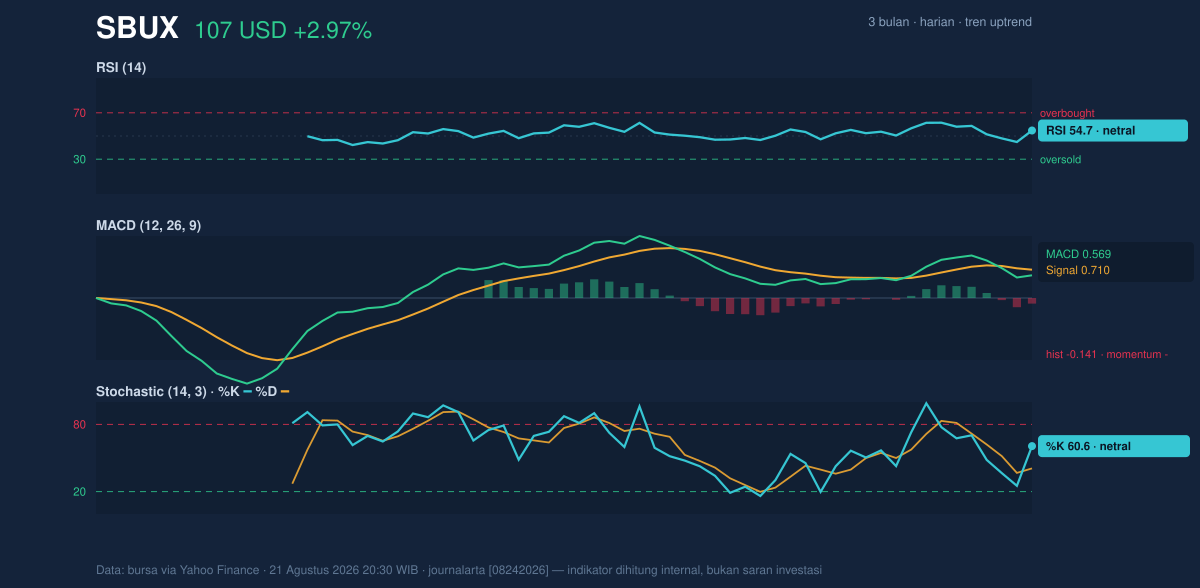
Momentum is less decisive than the trend. The RSI at 54.7 is neutral, which usually means the stock is neither stretched nor washed out. That is important because it leaves room for movement in either direction; there is no overbought signal forcing a pause, but there is also no oversold condition that would argue for a reflex rebound.
The Stochastic %K at 60.6 and %D at 40.8 is also neutral, though it leans a bit more constructive than the RSI because %K is above %D. That can indicate short-term buying interest is improving, but the signal is not strong enough to call it a full momentum breakout on its own.
The more cautionary point is the MACD at 0.569 versus signal at 0.710, with a histogram of -0.141. MACD measures trend momentum, and when the MACD line sits below its signal line, it often means the pace of the rally is slowing even if price has not yet rolled over. That is the current setup here: the trend is still up, but the engine is not accelerating.
Volatility & Volume
The Bollinger structure is one of the more interesting signals in the chart. The band width is 6.1%, described as a squeeze, which usually means volatility has contracted. Squeezes matter because they often precede a larger directional move once price exits the range. With price at %B 72%, SBUX is trading in the upper portion of the bands, but not at the extreme top. That leaves room for continuation, though the stock still needs a clean move through overhead resistance to prove it.
Volatility is not especially elevated. The ATR(14) at 2.71, or 2.5% of price, points to moderate daily movement. For readers, ATR is a gauge of how much a stock typically moves in a session; a mid-range reading like this suggests the stock can travel, but not in a disorderly way.
Volume is the main area of hesitation. Last volume was 5,550,000, below the 20-day average of 7,668,235, or about 0.7x normal. That means the latest rise came without broad participation. In technical analysis, price gains on light volume can still work, but they are usually less convincing than gains backed by stronger trading activity. The OBV is down, which adds to that caution: on-balance volume tracks whether money is flowing into or out of a stock, and a falling line while price rises can signal that accumulation is not keeping pace with the headline move.
Key Levels & Scenarios
The nearest technical floor is 103.10, the 20-hour support. That level matters because it sits just below the moving averages and near the lower part of the recent trading structure. If price holds above it, the uptrend remains intact and the market can continue to test the upper band.
The first visible ceiling is 108.55 resistance, just under the Bollinger upper band at 108.89. A sustained push through that area would suggest the squeeze is resolving upward and that the stock is trying to challenge the 3-month high of 110.51. If the shares fail at resistance and slip back under the mid-band near 105.65, the chart would look more like a stalled rally than an active breakout.
The signal to watch is simple: price is above support and moving averages, but momentum and volume have not yet fully confirmed that strength. That combination often leads to a sideways pause or a brief continuation attempt before the market chooses direction.
Technical Verdict: HOLD (wait & see)
HOLD (wait & see)
- SBUX is above the SMA20 and SMA50, which supports the trend, but the absence of a new MA cross means the move is not a fresh acceleration.
- MACD histogram is negative, showing momentum is weaker than price action suggests.
- Volume is only 0.7x normal and OBV is down, so the latest rise lacks full participation.
Verdict invalidated if price breaks below 103.10, because that would put the stock under near-term support and weaken the current uptrend structure.
- Ideal Entry Range: 103.10 to 105.65
- Exit Target: 108.55 to 108.89, with 110.51 as the next chart reference
- Stop Loss protection: below 103.10
In plain English: Starbucks looks technically healthy, but the chart still needs stronger momentum and volume before the next move becomes convincing.
Last fact: the 20-hour support sits at 103.10 and resistance at 108.55.
Summary Data SBUX
| Last price | 107.08 USD |
| Change 1 day / 5 days / 1 month | 2.97% / -0.57% / 3.71% |
| Trend / MA-cross | uptrend / none |
| SMA20 / SMA50 | 105.65 / 104.45 |
| RSI (14) / Stochastic %K | 54.7 / 60.6 |
| Bollinger %B / ATR | 72% / 2.71 |
| Support / Resistance 20 days | 103.10 / 108.55 |
| Data as of | 21 Agustus 2026 20:30 WIB |
Track SBUX stock price daily: live levels, support/resistance and our full SBUX analysis history.