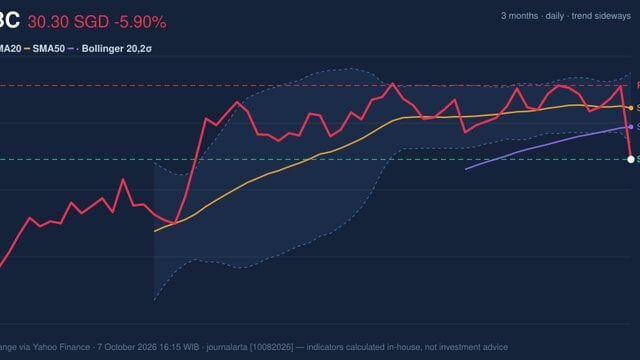
UOB Stock Gains 0.77% Today, Testing Support Level
On Agustus 24, 2026: price 40.53 SGD, trend sideways, RSI 36.1, support 40.22, resistance 43.89. technical analysis of uob stock. UOB Stock Gains — full…
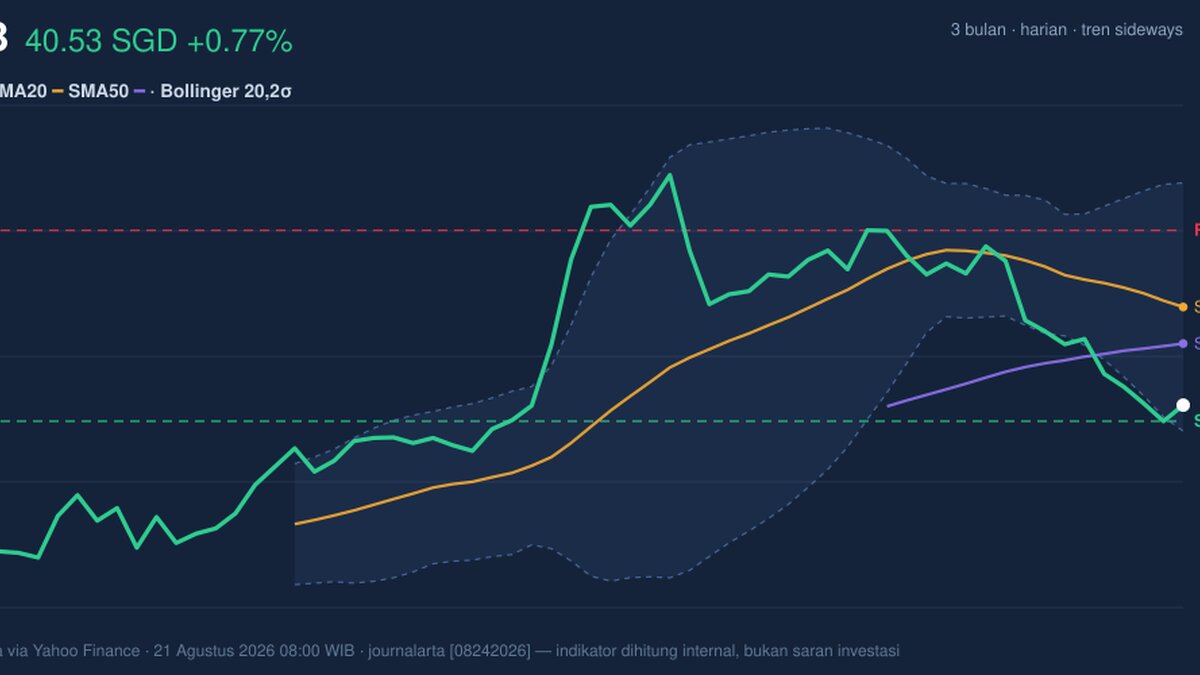
United Overseas Bank’s shares on SGX edged up to 40.53 SGD on 21 August 2026, a modest daily gain after a weak stretch, but the move still leaves the stock below its short- and medium-term trend markers, as shown in the chart. The price is now sitting just above the latest close and near the lower edge of its recent trading range, which tells investors the market is still trying to decide whether this is a pause in a downtrend or the start of a base.
Trend & Price Action
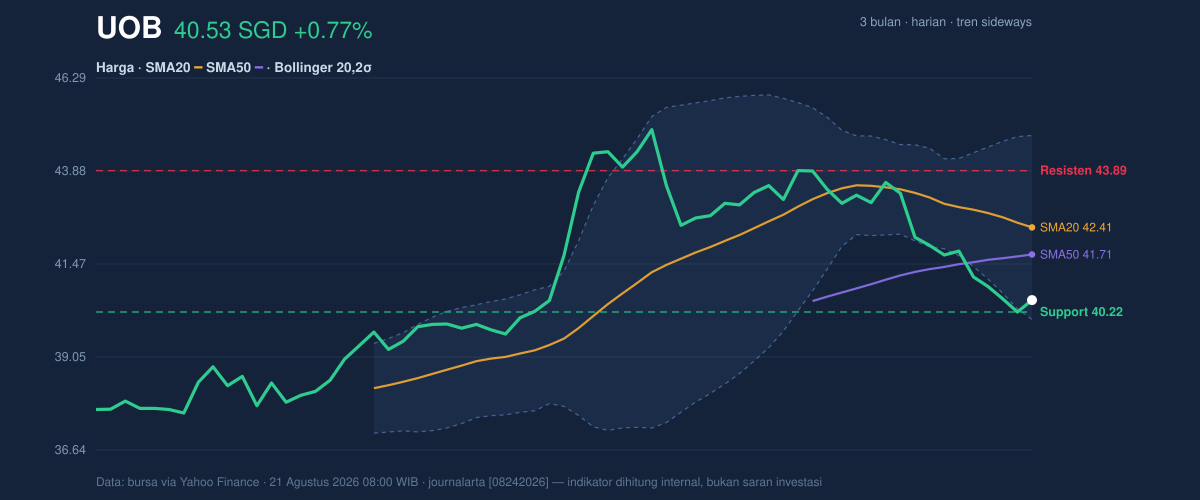
UOB is trading in a sideways pattern, but the slope of the SMA20 at -1.23% over 5 days shows that the short-term trend is still leaning lower rather than flattening out. The share price is also below the SMA20 at 42.41 and the SMA50 at 41.71, which matters because prices below both averages usually signal that recent buyers have not yet regained control. There is no fresh MA-cross, so the chart does not yet show a new trend reversal signal from moving averages.
The positioning inside the Bollinger Bands adds another layer. With the lower band at 40.03 and the last price at 40.53, UOB is hovering close to the band floor rather than the middle line at 42.41. That suggests the stock is trading near the lower end of its recent statistical range, where downside may be more limited in the immediate term, but where momentum still needs proof before any recovery can be trusted.
The broader range also frames the story. UOB is still well below the 3-month high of 45.15 and above the 3-month low of 37.51, which puts the current price in the lower half of its recent swing zone. In plain terms, the market is not pricing in a breakdown, but it is also not rewarding the stock with a clear recovery bid.
Oscillators & Momentum
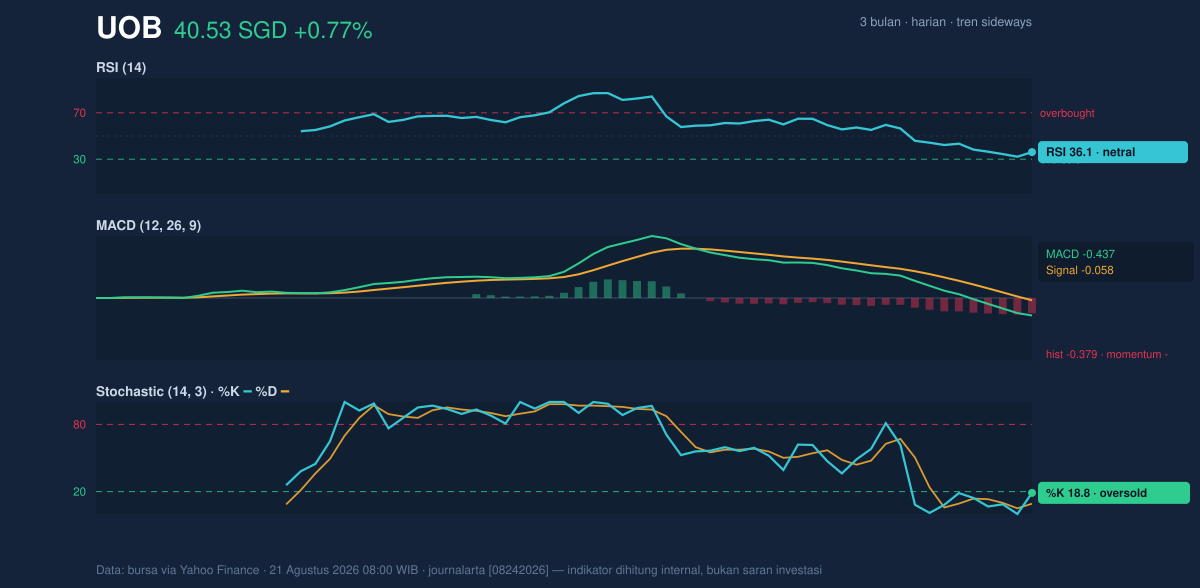
The momentum picture is mixed, and that mix is important. The RSI at 36.1 is technically neutral, but it is close enough to the oversold area to show that selling pressure has been persistent. At the same time, the Stochastic %K at 18.8 and %D at 9.2 sit in oversold territory, which often means the stock has been pushed down fast enough for a short-term rebound to become possible. That does not confirm a reversal; it only says the downside move may be stretched.
The MACD at -0.437, with the signal line at -0.058 and histogram at -0.379, keeps the stronger message negative. MACD is a trend-following indicator, so when it remains below zero and the histogram is negative, it usually means downside momentum is still dominant even if the stock bounces for a session or two. Put simply, the oscillators are not fully aligned: stochastic is flashing oversold, but MACD is still warning that the broader push remains weak.
Volatility & Volume
Volatility is present, but not extreme. The ATR(14) of 0.70, equal to 1.7% of price, points to a market that can move but is not in panic mode. The Bollinger Band width of 11.2% is described as normal, so this is not a squeeze setting up for a dramatic breakout, nor an expansion that would suggest a disorderly move already underway. In practical terms, the chart is giving traders a fairly ordinary volatility backdrop, which makes the current price zone important because the next move may depend more on direction than on speed.
Volume offers only limited confirmation. Last traded volume of 3,828,700 was roughly 1.0× normal versus the 20-day average, so the day’s rebound did not come with a surge of participation. That matters because a bounce on average volume can be just a reflex move unless it is followed by stronger turnover. The OBV is falling, which reinforces the idea that recent volume has not been strong enough to reverse the broader distribution pattern. In other words, buyers have not yet proven they are accumulating the stock in a meaningful way.
Key Levels & Scenarios
The first level to watch is 40.22, the 20-hour support and the prior close. That is the nearest line separating a stabilizing trade from another leg lower. Below that, the chart’s lower Bollinger band at 40.03 becomes the next technical reference, because a break beneath it would suggest the stock is slipping out of its lower-range cushion. On the upside, 41.71 is the first moving-average barrier, followed by 42.41, the SMA20 and Bollinger middle line, which often acts like a gravity point for price. Above that, 43.89 is the next resistance, and a move back through it would signal that sellers are losing their grip on the recent range.
If UOB holds above 40.22 and starts reclaiming 41.71, the chart would begin to look less fragile. If it fails to hold 40.03, the market would be telling us that the lower band is no longer containing the weakness.
Technical Verdict: HOLD (wait & see)
- Reason 1: Price remains below SMA20 at 42.41 and below SMA50 at 41.71, so the trend has not yet turned up.
- Reason 2: MACD is negative and the OBV is falling, which says momentum and participation still favor caution.
- Reason 3: Stochastic is oversold and price is near the lower Bollinger band at 40.03, so the stock is stretched enough to justify waiting for confirmation rather than chasing either direction.
- Verdict invalidated if price breaks below 40.03, because that would mean the lower band and nearby support have failed.
- Ideal Entry Range: 40.03 to 40.22
- Exit Target: 41.71 to 42.41
- Stop Loss protection: Below 40.03
For non-traders, this means the chart is not weak enough for panic, but it is not strong enough yet to show a clean recovery.
Summary Data UOB
| Last price | 40.53 SGD |
| Change 1 day / 5 days / 1 month | 0.77% / -3.04% / -5.74% |
| Trend / MA-cross | sideways / none |
| SMA20 / SMA50 | 42.41 / 41.71 |
| RSI (14) / Stochastic %K | 36.1 / 18.8 |
| Bollinger %B / ATR | 10% / 0.70 |
| Support / Resistance 20 days | 40.22 / 43.89 |
| Data as of | 21 Agustus 2026 08:00 WIB |
Track UOB share price daily: live levels, support/resistance and our full UOB analysis history.