AIA Stock Technicals Today: Gains 2.54%, Momentum Weakens
On Agustus 25, 2026: price 74.60 HKD, trend sideways, RSI 51.3, support 70.40, resistance 79.65. technical analysis of aia stock. AIA Stock Technicals — full…
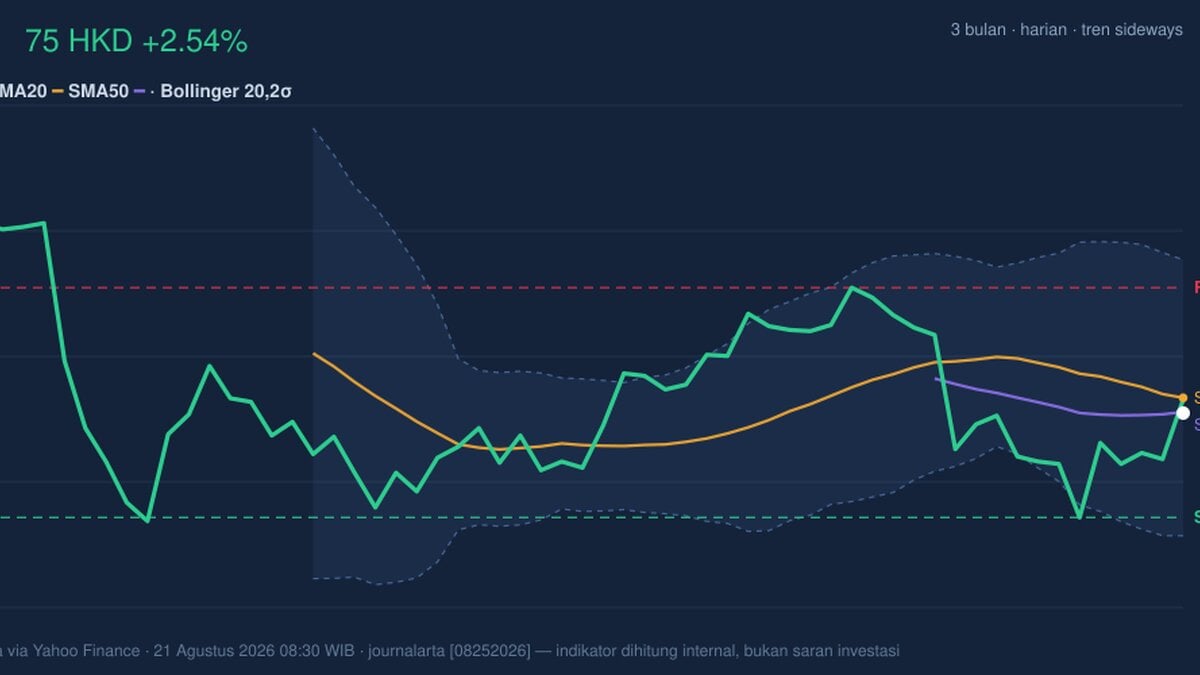
AIA Group’s shares finished at 74.60 HKD, up 2.54% on the day and 5.97% over five days, but still 4.48% lower over one month, according to data from the exchange feed via Yahoo Finance. That mix matters: the stock has bounced, yet the broader pattern remains a sideways market rather than a clean uptrend. In plain terms, traders are seeing a rebound inside a range, not a decisive shift in direction.
Trend & Price Action
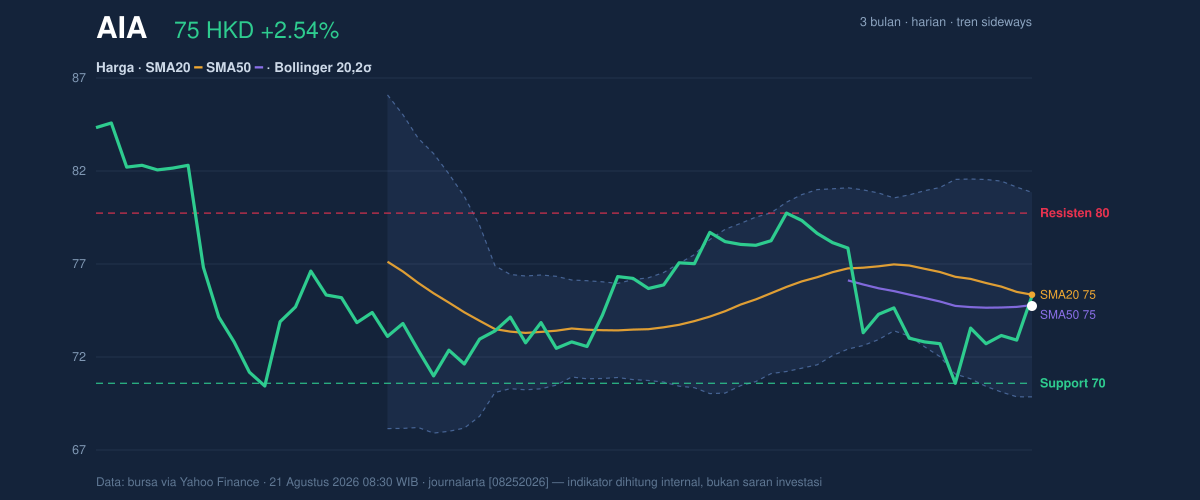
The share price is sitting just under the short-term average, with 74.60 HKD below the SMA20 at 75.22 and very close to the SMA50 at 74.65. That positioning is important because it shows the stock is hovering around the boundary between short-term weakness and medium-term stability. There is no new MA cross, so the market has not produced a fresh trend signal. In technical terms, that usually means conviction is limited: neither bulls nor bears have fully taken control.
The chart also shows the price at about 45% of the 20-day range, between 70.40 support and 79.65 resistance, which places it in the lower-middle part of the band rather than near breakout territory. The broader three-month range of 69.05 to 86.00 reinforces that the stock is still trading inside a wide envelope. That kind of structure often produces sharp moves only when price can clear the upper boundary or fail the lower one.
Oscillators & Momentum
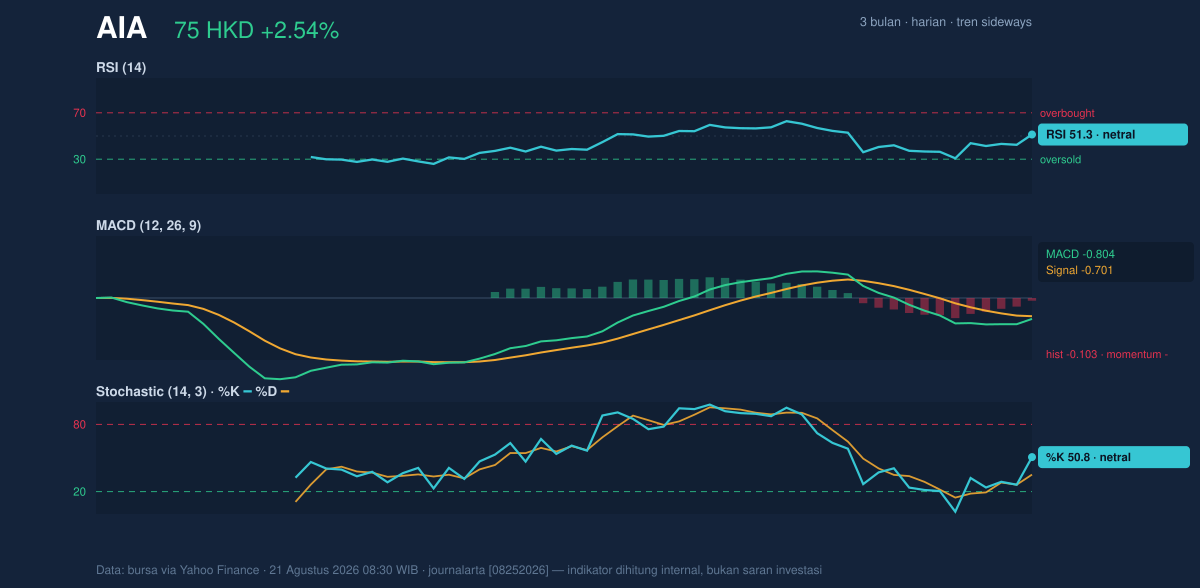
As shown in the chart, the momentum picture is mixed rather than decisive. RSI at 51.3 is neutral, which means the stock is neither overbought nor oversold and has room to move in either direction. Stochastic %K at 50.8 and %D at 35.2 is also neutral, but the gap between the two lines suggests short-term momentum has improved from a weaker base. That is a mild constructive sign, though not a strong one.
The more cautionary signal comes from MACD at -0.804, below the signal line at -0.701, with a histogram of -0.103. For general readers, MACD compares near-term and longer-term price momentum; when it stays below the signal line, it implies downside pressure is still slightly stronger than upside force. The negative histogram says that pressure has not fully reversed yet. Put simply, the stock has stopped falling hard, but the momentum engine has not clearly turned positive.
Volatility & Volume
Volatility is moderate. ATR(14) at 2.38, or 3.2% of price, suggests the stock can move enough in a session to matter, but not in a panic-like way. The Bollinger Band setup is also telling: price sits at %B 44%, with the middle band at 75.22, the upper band at 80.78, and the lower band at 69.66. A %B reading below 50% means the share price is still below the mid-band, so the recovery has not yet reclaimed the center of its recent trading corridor. The band width of 14.8% is normal, which means there is no squeeze suggesting an imminent volatility burst.
Volume adds a slight but not decisive confirmation. Last trading volume of 37,549,323 was about 1.2x the 20-session average of 30,538,311, so the bounce was backed by better participation than usual. But OBV is down, which is a warning that cumulative volume flow still leans weak. In other words, the latest session attracted more activity, but the broader volume trend has not yet flipped to accumulation.
Key Levels & Scenarios
The nearest technical floor is 70.40, the 20-session support. That level matters because it sits just above the three-month low of 69.05; a break below it would expose the lower end of the recent range and suggest the rebound has failed. On the upside, 75.22 is the immediate battleground at the SMA20, followed by 79.65 resistance. A move through the middle band and then the resistance zone would signal that the stock is no longer merely stabilizing, but attempting to rebuild trend structure.
A practical reading of the chart is this: if price can hold above 74.65 and reclaim 75.22, the market would be showing better short-term balance. If it slips back below 70.40, the range starts to look vulnerable, and the recent bounce would lose credibility.
Technical Verdict: HOLD (wait & see)
HOLD (wait & see)
- RSI at 51.3 and Stochastic at 50.8 / 35.2 are neutral, so momentum is not strong enough to confirm a clean directional move.
- MACD remains negative at -0.804 versus the signal line at -0.701, showing that downside pressure has eased but not disappeared.
- Price below SMA20 at 75.22, with no new MA cross, indicates the stock has not yet reclaimed a convincing short-term trend.
Verdict invalidated if price falls below 70.40.
- Ideal Entry Range: 70.40 to 75.22
- Exit Target: 79.65
- Stop Loss protection: below 69.66 or more conservatively below 70.40
For non-traders: the shares are bouncing, but the chart still looks like a stock waiting for proof rather than one already in a clear trend.
Summary Data AIA
| Last price | 74.60 HKD |
| Change 1 day / 5 days / 1 month | 2.54% / 5.97% / -4.48% |
| Trend / MA-cross | sideways / none |
| SMA20 / SMA50 | 75.22 / 74.65 |
| RSI (14) / Stochastic %K | 51.3 / 50.8 |
| Bollinger %B / ATR | 44% / 2.38 |
| Support / Resistance 20 days | 70.40 / 79.65 |
| Data as of | 21 Agustus 2026 08:30 WIB |
Track AIA share price daily: live levels, support/resistance and our full AIA analysis history.