Alibaba Stock Analysis: Drops 10.86%, Testing Support Level
On Agustus 25, 2026: price 112.50 HKD, trend sideways, RSI 54.3, support 111.00, resistance 128.10. technical analysis of alibaba stock.
Alibaba Group’s Hong Kong-listed shares fell to HKD 112.50 on the Hong Kong exchange on 21 August 2026, dropping 10.86% from the previous close as the stock slipped back toward the lower edge of its recent trading band. The move matters less for the headline percentage than for what it says about positioning: Alibaba is now trading below its SMA20 at 121.63 but still above its SMA50 at 111.85, which puts the stock in a fragile middle ground rather than a clean trend. As shown in the chart, that is the kind of setup where markets are watching whether a pullback is just a reset inside a sideways range or the start of a deeper break.
Trend & Price Action
The price structure is still described as sideways, and the slope of the SMA20 at 2.10% over 5 days suggests the short-term average is rising even as the share price has retreated beneath it. That combination usually signals a market that has not fully lost direction, but is struggling to hold recent gains. The fact that there is no new MA-cross also matters: there is no fresh moving-average crossover to confirm a new bullish or bearish regime, so the chart is not yet giving a decisive trend signal.
The stock is also sitting near the lower end of its near-term range. The 20-hour support at HKD 111.00 is close to the last price, while 20-hour resistance at HKD 128.10 remains well overhead. In practical terms, Alibaba is trading in the bottom 9% of that range, which tells readers the market is pricing in caution rather than conviction. The broader 3-month high of 131.20 and 3-month low of 88.65 frame the bigger picture: the share price is not in panic territory, but it is clearly far from the upper bound that would signal stronger demand.
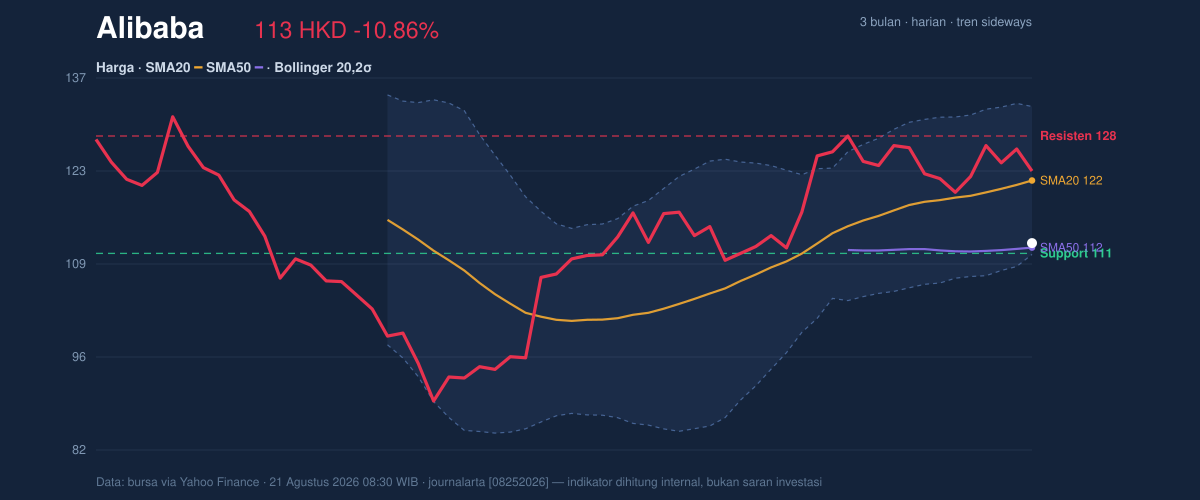
One sharp point stands out: the stock is holding just above a key floor, but it is no longer comfortably above it.
Oscillators & Momentum
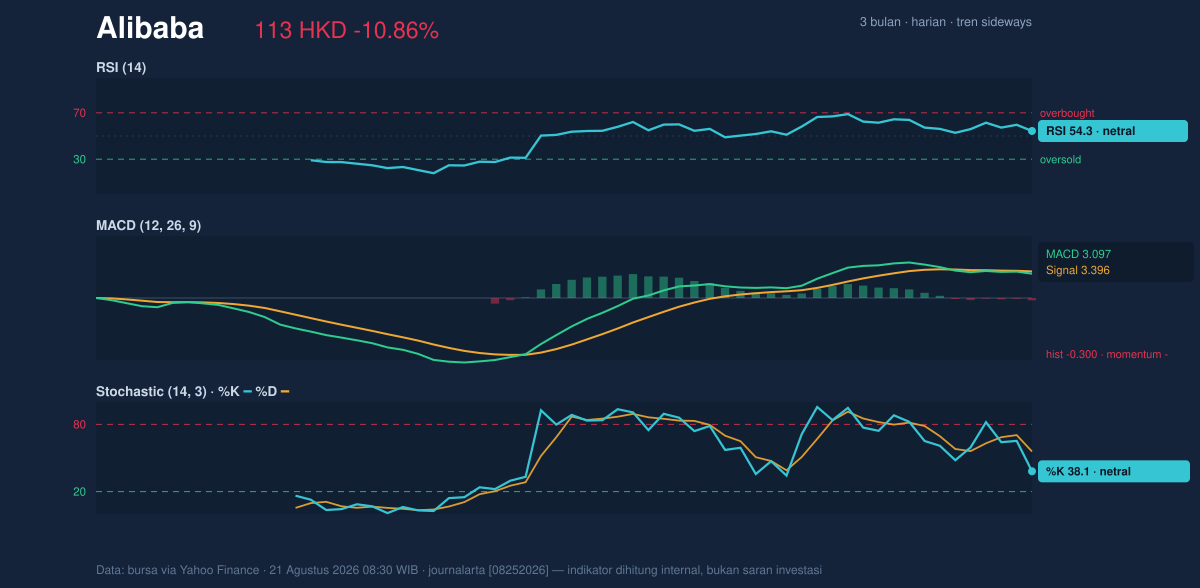
Momentum indicators are mixed, and that is the most important clue in the current setup. The RSI(14) at 54.3 is neutral, which means the stock is neither stretched on the upside nor oversold after the selloff. In plain language, RSI is not warning of exhaustion or bargain conditions; it is simply saying the move has room to continue in either direction.
The Stochastic %K at 38.1 and %D at 55.8 are also neutral, but the gap between them shows short-term momentum has softened. Stochastic is useful for spotting whether price is closing near the top or bottom of its recent range; here, the weaker %K versus %D suggests the latest bounce attempts are losing some traction. That does not by itself confirm a breakdown, but it does show buyers are not pressing the stock aggressively.
Most telling is the MACD at 3.097 versus the signal line at 3.396, with a histogram of -0.300. MACD is a trend-following momentum gauge, and when the histogram turns negative it means the faster line has moved below the slower signal line. In simple terms: the stock’s internal momentum is now pointing lower, even though the broader trend has not fully rolled over. That is a warning light, not a crash signal.
Volatility & Volume
Volatility is elevated. The ATR(14) of 4.54, equal to 4.0% of price, implies the stock can move meaningfully in a single session. ATR measures the typical daily range, so this reading tells traders that a one-day swing of several Hong Kong dollars is not unusual right now. That matters because a stock sitting near support with high ATR can either rebound sharply or slice through the floor quickly.
Bollinger Bands add another layer. The lower band at 110.85 sits just under the HKD 111.00 support, while the middle band at 121.63 aligns exactly with the SMA20. The last price is only around the bottom of the band structure, with %B at 8%, which means the share price is trading very close to the lower band rather than the midpoint. That often reflects short-term pressure, but it can also mark a zone where selling becomes more crowded. The 17.7% band width is described as normal, so this is not a volatility squeeze waiting for a dramatic expansion; instead, the market is already moving with enough room for further swings.
Volume is the counterweight to the price drop. Last volume of 146,890,540 was 1.7x the 20-hour average of 88,481,995, which signals strong participation in the selloff. High volume on a down day often means the move is being accepted by the market rather than ignored. Yet OBV is down, and OBV tracks whether volume is accumulating or distributing over time. That combination suggests the heavier trading is not currently supporting the price; instead, it is leaning toward distribution.
Key Levels & Scenarios
The immediate technical map is straightforward. HKD 111.00 is the first level to watch on the downside because it sits just above the 110.85 lower Bollinger band. If that floor holds, Alibaba could stabilize inside the current sideways structure and attempt to recover toward HKD 121.63, where the SMA20 and Bollinger middle band converge. If price fails to hold HKD 111.00, the chart would likely shift from a range-bound pullback to a more pronounced bearish phase, with the broader range low at HKD 88.65 becoming the next major reference point.
On the upside, HKD 128.10 is the near-term resistance that would need to be reclaimed to suggest the latest weakness is fading. Above that, the 3-month high of 131.20 marks the ceiling of the wider recovery range. For now, the stock is positioned below the center of its band structure, which means rallies still need proof.
Technical Verdict: HOLD (wait & see)
HOLD (wait & see) is the clearest technical reading because the chart is caught between a firm short-term setback and an unbroken medium-term range.
- MACD histogram at -0.300 shows momentum has turned negative.
- Price below SMA20 at 121.63 signals the short-term trend has weakened.
- Volume at 1.7x average confirms the drop has real participation, while OBV down suggests distribution rather than accumulation.
Verdict invalidated if price breaks below HKD 111.00, because that would place the stock through support and beneath the lower Bollinger band.
- Ideal Entry Range: HKD 111.00 to 121.63, where support and the SMA20/Bollinger midline cluster.
- Exit Target: HKD 128.10, with the wider resistance reference at 131.20.
- Stop Loss protection: below 110.85 to 111.00, using the lower band and support as the risk boundary.
In plain English: the stock is not broken, but it has lost enough momentum that the next move needs confirmation before the chart turns constructive again.
Alibaba’s last traded price on the Hong Kong exchange was HKD 112.50.
Summary Data Alibaba
| Last price | 112.50 HKD |
| Change 1 day / 5 days / 1 month | -10.86% / -6.17% / 2.27% |
| Trend / MA-cross | sideways / none |
| SMA20 / SMA50 | 121.63 / 111.85 |
| RSI (14) / Stochastic %K | 54.3 / 38.1 |
| Bollinger %B / ATR | 8% / 4.54 |
| Support / Resistance 20 days | 111.00 / 128.10 |
| Data as of | 21 Agustus 2026 08:30 WIB |
Track Alibaba share price daily: live levels, support/resistance and our full Alibaba analysis history.