OCBC Stock Gains 0.45%, Momentum Weakens In Focus
On Agustus 25, 2026: price 30.92 SGD, trend uptrend, RSI 65.3, support 28.63, resistance 31.79. technical analysis of ocbc stock. OCBC Stock Gains — full…
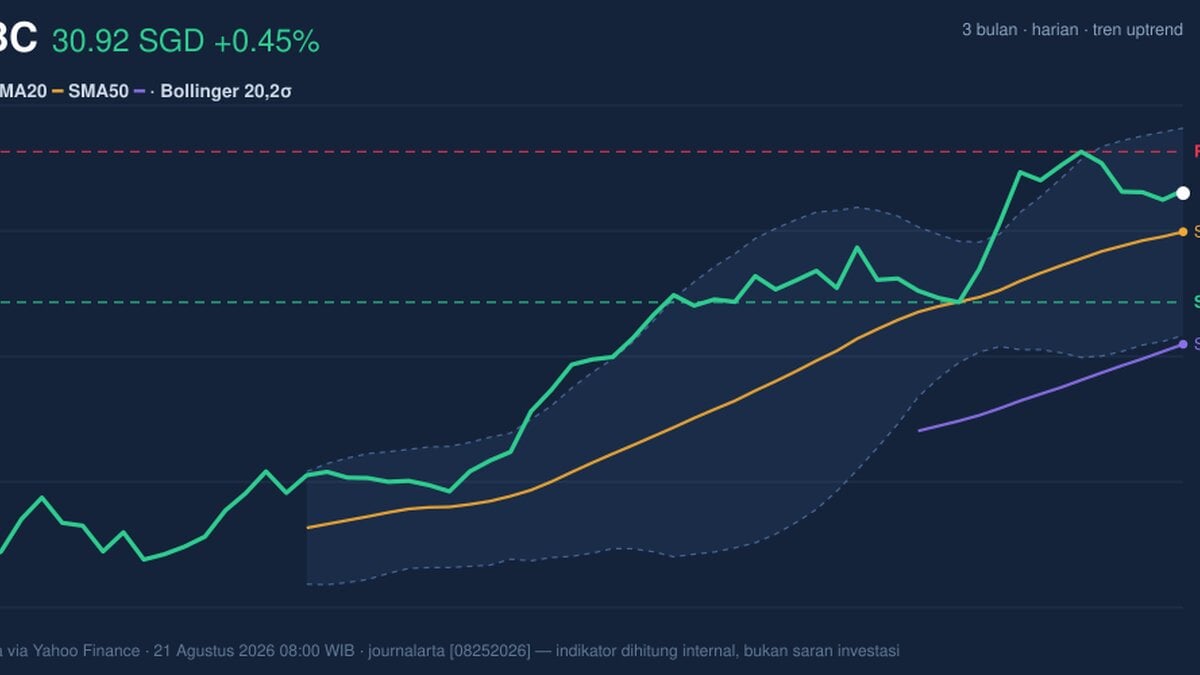
OCBC Bank’s SGX-listed shares edged up to SGD 30.92 on 21 August 2026, a modest 0.45% daily gain that sits inside a larger one-month advance of 6.99%. The move keeps the counter in an established uptrend, but the tape is no longer showing the clean acceleration seen earlier in the month. As shown in the chart, the stock is still trading above its short-term trend line, yet the latest momentum readings suggest the rally is pausing rather than extending with force.
Trend & Price Action
The most important signal is structural: OCBC remains above its SMA20 at SGD 30.11 and well above its SMA50 at SGD 27.75. That positioning matters because it tells investors the market is still pricing the shares above both the recent average and the medium-term base, which usually reflects persistent demand rather than a one-day bounce. The SMA20 slope is up 1.90% over 5 days, reinforcing that the short-term trend is still rising.
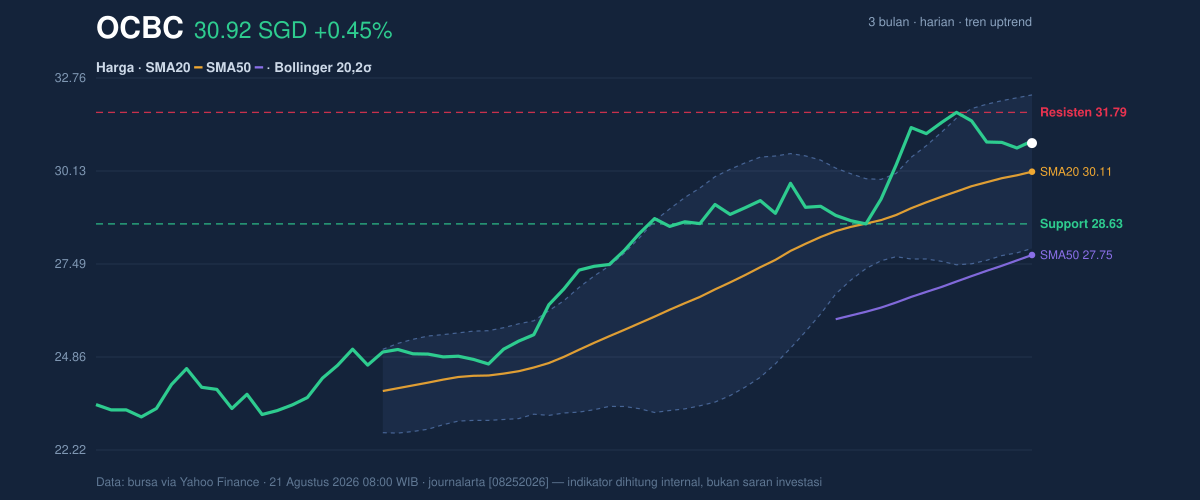
There is, however, no fresh moving-average crossover to add a new layer of confirmation. In plain terms, the trend is already in place, but it is not being reinforced by a new technical trigger. Price is also sitting at about 72% of the 20-hour range, closer to resistance than support, which means the market has already done much of the near-term work and may need stronger volume to push higher. The stock’s 3-month high of SGD 31.86 is now a nearby reference point, only slightly above the current resistance band.
Oscillators & Momentum
Momentum is more mixed than the price chart alone suggests. The RSI at 65.3 is described as neutral, but it is close enough to the upper end of the range to show the shares are not cheap on a short-term basis. The Stochastic %K at 73.6 and %D at 71.2 are also neutral, yet both are elevated, which usually means the stock has been trading near recent highs and may be vulnerable to hesitation if buyers lose urgency.
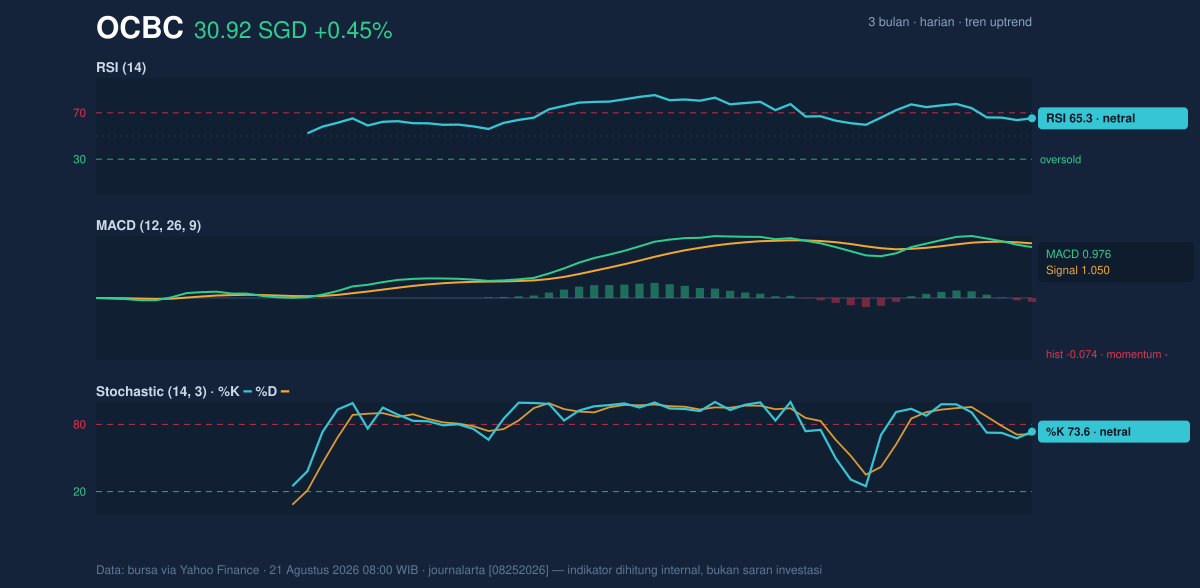
The clearest warning comes from MACD. The MACD at 0.976 remains positive, which means the broader trend has not broken, but it sits below the signal line at 1.050 and the histogram is -0.074. That negative histogram is important: it shows the pace of upside momentum has slipped below the trend’s own average. In practical terms, OCBC is still rising, but the rise is less energetic than before, and that often precedes a period of consolidation rather than an immediate breakout.
Volatility & Volume
Volatility is contained rather than stretched. The Bollinger Band width of 14.4% is normal, so the stock is not in a compression phase that typically precedes a sharp move, nor is it in an unusually wide, unstable state. Price sits with %B at 69%, which places it in the upper portion of the band but not at the extreme top. That positioning usually indicates strength with some room left, though not much margin for disappointment.
The ATR at 0.69, or 2.2% of price, points to moderate daily movement. That is enough for meaningful swings, but not so high that the chart is signalling disorder. Volume is the softer part of the picture. The latest turnover of 5,788,200 is only 0.8× the 20-session average of 7,021,024, so the recent advance has not been backed by unusually strong participation. That matters because price gains on lighter volume can be fragile. The one constructive offset is that OBV is rising, which suggests the longer-running balance of buying pressure still leans positive even if the latest session was not heavily traded.
Key Levels & Scenarios
The immediate map is straightforward. Support at SGD 28.63 is the first line the market would need to defend if sentiment cools. On the upside, resistance at SGD 31.79 is the nearest ceiling, just below the 3-month high of SGD 31.86. That cluster is important because it marks the area where recent gains may meet supply from holders looking to lock in profits.
If price can clear SGD 31.79 with stronger volume, the chart would be signaling that the current pause has resolved in favour of continuation. If it fails there, the more likely outcome is a drift back toward the middle of the Bollinger band at SGD 30.11, where the short-term trend line and average price converge. A loss of SGD 28.63 would weaken the uptrend’s near-term structure and shift attention to the lower band at SGD 27.94, where the market would be testing whether the recent advance was only a temporary rebound.
Technical Verdict: HOLD (wait & see)
HOLD (wait & see)
- MACD is negative versus its signal line, showing momentum has softened even though the broader trend is still intact.
- Price remains above SMA20 and SMA50, which keeps the uptrend alive and argues against a bearish call.
- Volume is below average at 0.8×, so the latest rise lacks the participation usually needed to confirm a clean breakout above resistance.
Verdict invalidated if price falls below SGD 28.63, because that would break the nearest support and weaken the short-term structure.
- Ideal entry range: SGD 30.11 to SGD 28.63
- Exit target: SGD 31.79 to SGD 31.86
- Stop loss protection: below SGD 28.63
In plain English: the stock is still in an uptrend, but the latest signals say the move needs stronger confirmation before it can be treated as a fresh advance.
Summary Data OCBC
| Last price | 30.92 SGD |
| Change 1 day / 5 days / 1 month | 0.45% / -2.74% / 6.99% |
| Trend / MA-cross | uptrend / none |
| SMA20 / SMA50 | 30.11 / 27.75 |
| RSI (14) / Stochastic %K | 65.3 / 73.6 |
| Bollinger %B / ATR | 69% / 0.69 |
| Support / Resistance 20 days | 28.63 / 31.79 |
| Data as of | 21 Agustus 2026 08:00 WIB |
Track OCBC share price daily: live levels, support/resistance and our full OCBC analysis history.