Tencent Testing Support Level: Stock Drops 2.53% (Agustus 25, 2026)
On Agustus 25, 2026: price 440.00 HKD, trend sideways, RSI 49.5, support 440.00, resistance 492.20. technical analysis of tencent stock.
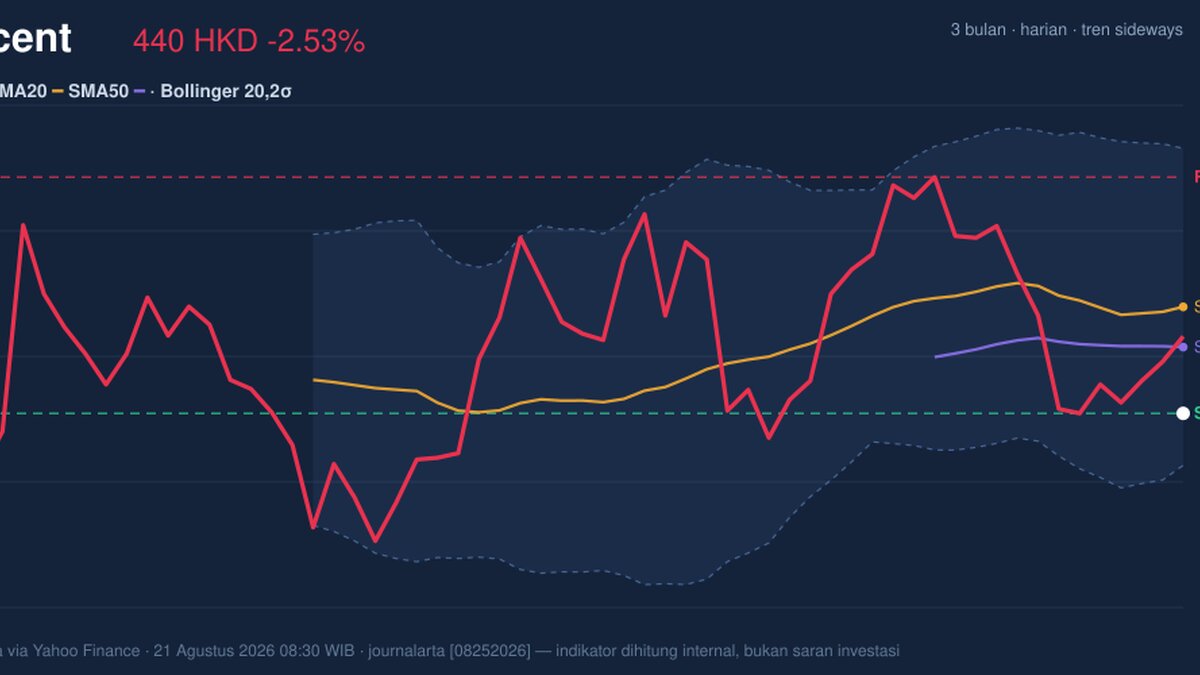
Tencent Holdings slipped on the Hong Kong exchange on 21 August 2026, with 0700.HK last changing hands at 440.00 HKD, down from 451.40 HKD at the previous close, as the stock drifted back toward the lower end of its recent trading band. The move matters less for the one-day drop itself than for what it says about positioning: Tencent is still moving sideways, but the tape is now leaning against the lower half of the range, with momentum failing to rebuild even after a month that was still slightly positive.
The chart shows a stock that has not broken down decisively, but has also not managed to reclaim its short-term trend. That is the key message.
Trend & Price Action
Tencent is trading below its SMA20 at 463.55 and also below its SMA50 at 454.66, which tells us the stock is sitting under both its short- and medium-term reference points. In plain terms, the market is not yet rewarding buyers who stepped in over the past few weeks. The sideways trend classification, combined with an SMA20 slope of -0.30% over 5 days, suggests the stock is not in a clean downtrend, but the bias has softened enough to keep rallies contained.
The lack of a new MA-cross matters too. A fresh crossover often signals a change in trend direction; here, its absence means Tencent has not produced that kind of technical confirmation. Instead, the price remains in a holding pattern, with the market waiting for a stronger catalyst.
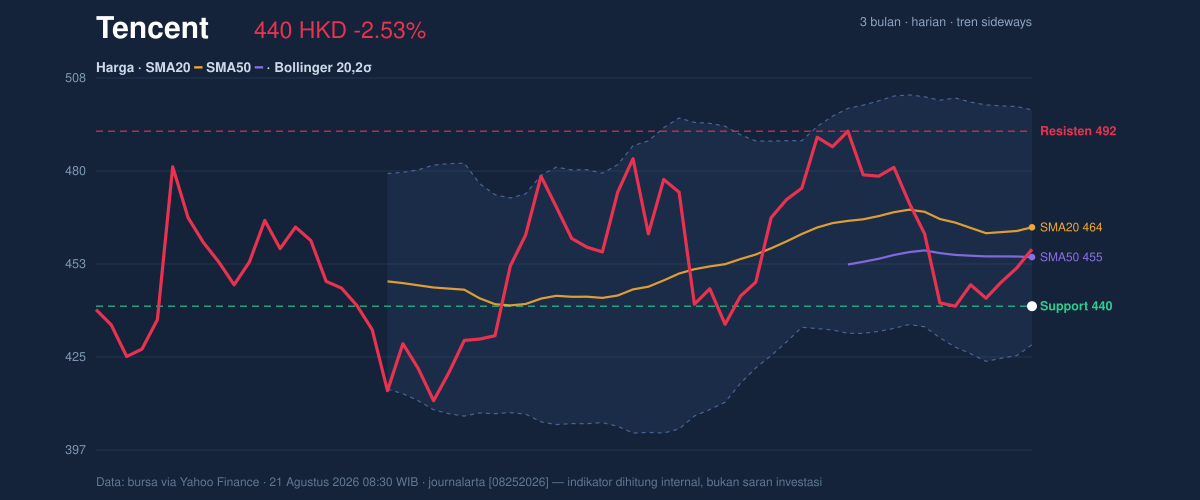
The broader range is also telling. Tencent is trading near the bottom of its 3-month range of 411.00 to 497.80, and the current 20-hour support at 440.00 is exactly where the stock is sitting now. That means the market is testing a level where buyers have recently been willing to show up, but there is no cushion left at the moment. Resistance at 492.20 remains well overhead, which keeps the upside capped unless the price can first recover the moving averages.
A flat stock under its averages is not broken. But it is vulnerable.
Oscillators & Momentum
The momentum picture is mixed on the surface, but weak underneath. RSI at 49.5 is neutral, which means Tencent is neither stretched nor oversold; it is simply undecided. The Stochastic %K at 34.0 and %D at 25.7 also sit in neutral territory, but the low placement near the lower part of the scale hints that price is closer to a short-term recovery zone than to an overheated one. That said, neutral oscillators only help if price starts to turn. So far, they have not.
The more important signal comes from MACD. MACD at -2.596, below the signal line at 0.096, with a histogram of -2.693, points to negative momentum still dominating. In practical terms, that means recent price action is losing energy on the downside, but not yet enough to produce a reversal signal. The market is still pressing lower relative to its recent trend, even if the pace is not accelerating dramatically.
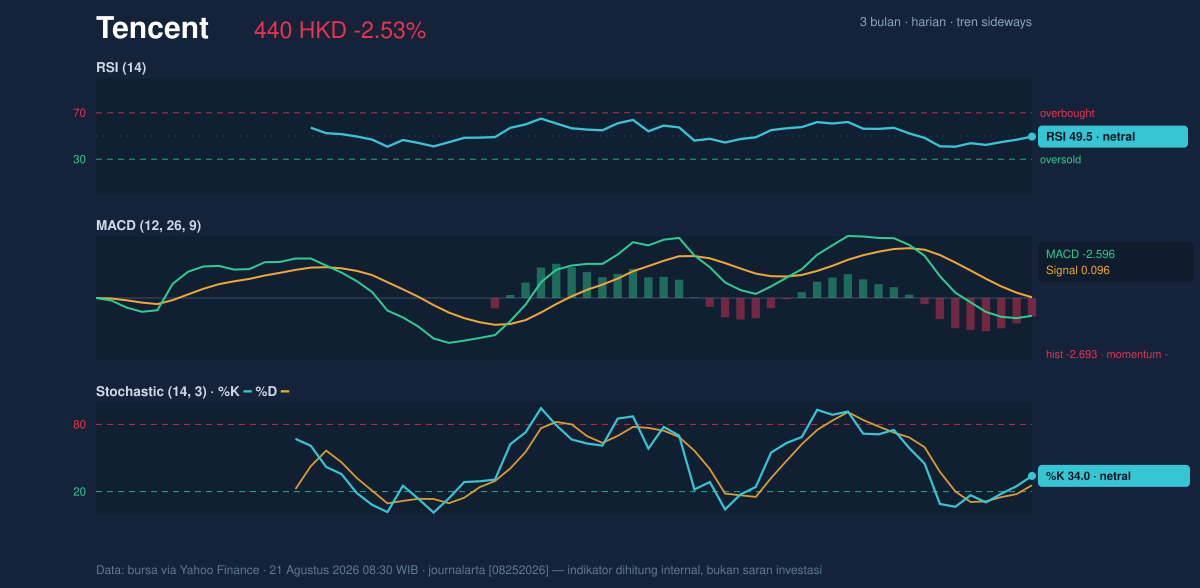
This is why the stock feels stuck: oscillators are not oversold enough to force a bounce, while MACD is not constructive enough to confirm one.
Volatility & Volume
Bollinger Bands help frame the current positioning. Tencent is trading near the lower band, with %B at 16%, meaning the price is close to the bottom of the band structure rather than the middle. That often signals a stock is trading in the lower part of its recent statistical range. The band width of 15.1% is described as normal, not squeezed. So this is not a setup where volatility is compressed and about to explode; instead, the market is already active enough, but direction remains unresolved.
ATR at 12.17, or 2.8% of price, reinforces that view. Volatility is moderate, which matters because a move through support or back above the moving averages would not need a dramatic shock to develop. The stock can travel, but it needs a trigger.
Volume offers no strong confirmation for a rebound. Last volume was 22,326,906, below the 20-hour average of 26,172,838, or 0.9× normal. That means the latest move was not backed by stronger participation. When price weakens on lighter volume, it can sometimes suggest a lack of conviction. But the OBV is falling, which is the more important part: on-balance volume tracks whether money is accumulating or leaving over time, and here it implies distribution is still outweighing accumulation.
So the stock is not just drifting lower; it is doing so without convincing demand stepping in.
Key Levels & Scenarios
The immediate technical battleground is clear. Support at 440.00 is being tested right now, and resistance at 492.20 is the first major ceiling above. With the price sitting at the 0% point of the 20-hour range, Tencent is effectively pressing the floor rather than ranging in the middle.
If 440.00 fails to hold, the chart opens room toward the lower edge of the broader band structure, with the Bollinger lower band at 428.52 becoming the next visible technical reference. If, instead, the stock can recover above the middle band at 463.55 and then the SMA50 at 454.66, that would signal a more credible attempt to stabilize. A move back toward 492.20 would then become a test of whether the market is willing to reprice Tencent back into the upper half of its range.
Technical Verdict: HOLD (wait & see)
HOLD (wait & see) fits the current setup because:
- Price is below SMA20 and SMA50, so the near-term trend has not turned constructive.
- MACD remains negative, showing downside momentum still outweighs any recovery attempt.
- Volume is below average and OBV is falling, which weakens the case for an immediate reversal.
Verdict invalidated if price breaks below 440.00 and fails to recover, because that would confirm the current support has given way.
- Ideal Entry Range: 440.00 to 454.66, only if price stabilizes back above support and the SMA50
- Exit Target: 463.55 to 492.20, using the Bollinger middle band first and resistance second
- Stop Loss protection: below 428.52, aligned with the lower Bollinger band
For non-traders: Tencent is not showing a clean breakdown, but it has also not yet proven that buyers have taken control again.
“440.00 is the line the market is watching now — and if it gives way, the tone changes fast.”
Summary Data Tencent
| Last price | 440.00 HKD |
| Change 1 day / 5 days / 1 month | -2.53% / 0.00% / 1.24% |
| Trend / MA-cross | sideways / none |
| SMA20 / SMA50 | 463.55 / 454.66 |
| RSI (14) / Stochastic %K | 49.5 / 34.0 |
| Bollinger %B / ATR | 16% / 12.17 |
| Support / Resistance 20 days | 440.00 / 492.20 |
| Data as of | 21 Agustus 2026 08:30 WIB |
Track Tencent share price daily: live levels, support/resistance and our full Tencent analysis history.