UOB Testing Support Level: Stock Gains 1.27% (Agustus 25, 2026)
On Agustus 25, 2026: price 40.73 SGD, trend sideways, RSI 36.1, support 40.22, resistance 43.89. technical analysis of uob stock. UOB Testing Support Level —…
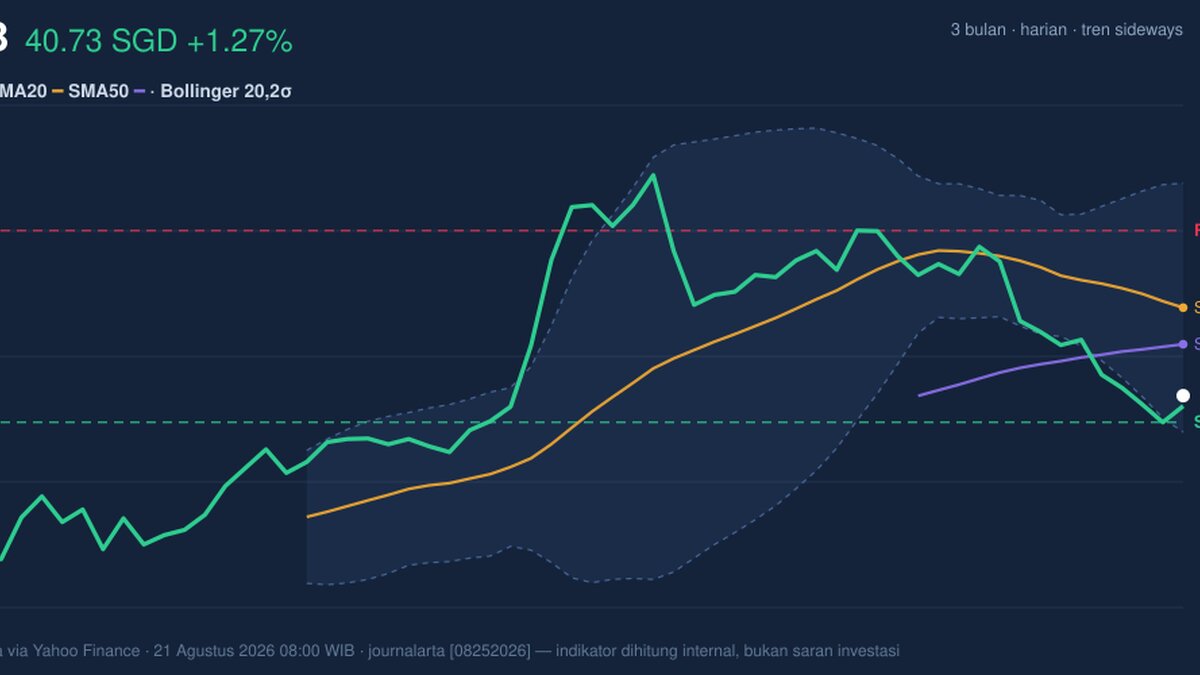
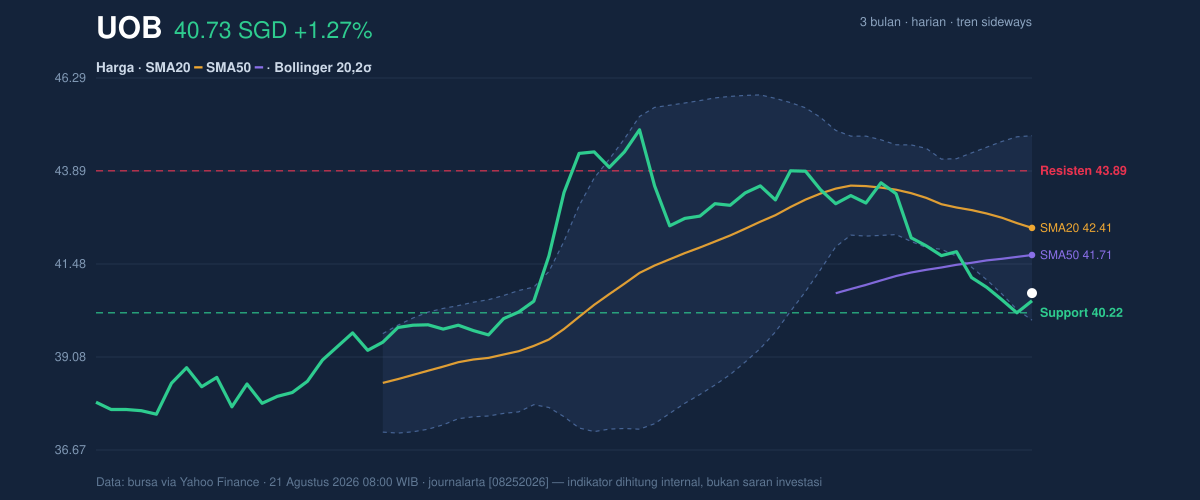
United Overseas Bank’s shares on SGX rose to 40.73 SGD as of 21 August 2026 08:00 WIB, up from the previous close of 40.22, but the move sits inside a broader pattern of hesitation rather than a clean recovery. The stock is still trading below its SMA20 at 42.41 and below its SMA50 at 41.71, which means the latest bounce has not yet repaired the short-term damage in the chart. As shown in the chart, UOB remains in a sideways trend, and the market is still paying attention to whether this is merely a pause near support or the start of something more durable.
Trend & Price Action
The price structure is telling a cautious story. UOB’s 40.73 SGD last trade is only modestly above the 20-hour support at 40.22, and that places the stock near the lower edge of its recent range rather than near the middle or upper band. The stock is sitting at roughly 14% of the 20-hour range, which signals that sellers have already pushed it close to the floor of the current band, but buyers have not yet forced a decisive reversal.
The broader range matters too. Over the past three months, UOB has traded between 45.15 and 37.52, so the current level is closer to the lower half of that span. That positioning suggests the market is still digesting earlier weakness. There is no fresh MA-cross, meaning the moving averages have not delivered a new trend signal; in plain English, the chart has not yet produced the kind of crossover that would usually confirm a stronger directional move. The SMA20 slope of -1.23% over five days reinforces that point: the short-term trend is still drifting lower, even if the latest session posted a gain.
Oscillators & Momentum
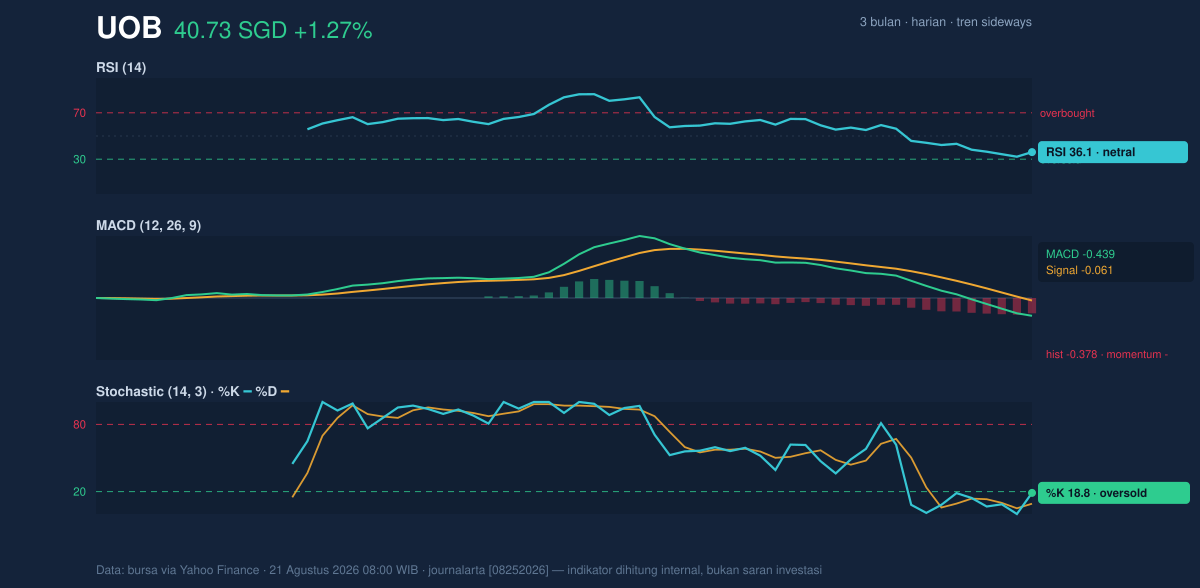
Momentum indicators are mixed, and that mix is important. The RSI at 36.1 is still neutral but leaning weak, which means the stock is not yet deeply oversold, even though it is approaching the zone where bargain-hunting often starts to appear. The Stochastic %K at 18.8 and %D at 9.2 are already in oversold territory, which usually means the recent selling has been strong enough to stretch the short-term price action. That does not guarantee an immediate rebound, but it does show that downside pressure may be getting tired.
The bigger warning comes from MACD. The MACD at -0.439, below the signal line at -0.061, with a histogram of -0.378, points to momentum that is still negative and not yet turning. In practical terms, the stock can be oversold without being ready to recover; MACD is saying the downtrend has not been convincingly interrupted. As shown in the chart, the oscillators are not fully aligned: Stochastic suggests exhaustion, while MACD still reflects bearish momentum.
Volatility & Volume
Volatility is present, but not extreme. The ATR(14) of 0.70, equal to 1.7% of price, indicates moderate daily movement, so UOB is not behaving like a highly erratic stock right now. That matters because moderate ATR gives the market room to probe support without necessarily implying panic; it also means any breakout would need more than a one-session push to look convincing.
The Bollinger setup adds another layer. Price is near the lower band, with %B at 15%, which means the stock is trading close to the bottom of its recent volatility envelope. The lower band at 40.03 is especially relevant because the current price is only slightly above it. The Bollinger band width of 11.2% is normal, not squeezed, so the chart does not currently suggest an imminent volatility explosion. In other words, the market is compressed enough to be watchful, but not so compressed that a sharp move is being strongly telegraphed.
Volume does not yet confirm a strong turn. Last volume was 3,828,700, just about 1.0× the 20-day average of 3,706,462. That is participation, but not conviction. More importantly, OBV is falling, and that tells a simple but critical story: even if the price has bounced a little, the underlying flow of shares has still been net negative. When volume-based accumulation is absent, rebounds can fade quickly.
Key Levels & Scenarios
The market is currently balancing between a nearby floor and a more meaningful ceiling. Support at 40.22 is the first line that matters, because it is almost exactly where the stock has recently found footing. Just below that, the Bollinger lower band at 40.03 offers a second technical reference; a break beneath it would suggest that the recent bounce has failed to hold even the lower edge of normal volatility. On the upside, resistance at 43.89 is the near-term barrier, while the SMA20 at 42.41 and SMA50 at 41.71 sit above the current price and act as intermediate hurdles.
If UOB can reclaim the SMA50 at 41.71 and then the SMA20 at 42.41, the chart would start to look less fragile, because that would show the stock climbing back into the main body of its recent range. If instead it slips below 40.22 and then loses 40.03, the oversold signals would become less useful as a timing tool, and the market would likely be treating the recent bounce as a failed base.
Technical Verdict: HOLD (wait & see)
HOLD (wait & see)
- RSI at 36.1 and Stochastic at 18.8 / 9.2 show the stock is stretched on the downside, but not yet paired with a convincing reversal.
- MACD remains negative and OBV is falling, which means momentum and participation still favor caution.
- Price is still below SMA20 at 42.41 and below SMA50 at 41.71, so the trend has not yet re-established itself.
Verdict invalidated if price breaks below 40.03.
- Ideal Entry Range: 40.03 to 40.22
- Exit Target: 41.71 to 42.41
- Stop Loss protection: below 40.03
In plain English, the chart is close to support, but it has not yet shown enough strength to prove the bounce is real.
Summary Data UOB
| Last price | 40.73 SGD |
| Change 1 day / 5 days / 1 month | 1.27% / -2.56% / -5.28% |
| Trend / MA-cross | sideways / none |
| SMA20 / SMA50 | 42.41 / 41.71 |
| RSI (14) / Stochastic %K | 36.1 / 18.8 |
| Bollinger %B / ATR | 15% / 0.70 |
| Support / Resistance 20 days | 40.22 / 43.89 |
| Data as of | 21 Agustus 2026 08:00 WIB |
Track UOB share price daily: live levels, support/resistance and our full UOB analysis history.