Momentum Weakens, HSBC Stock Gains 0.41% Today
On Agustus 31, 2026: price 1,528.40 GBp, trend sideways, RSI 46.3, support 1,497.20, resistance 1,597.40. technical analysis of hsbc stock.
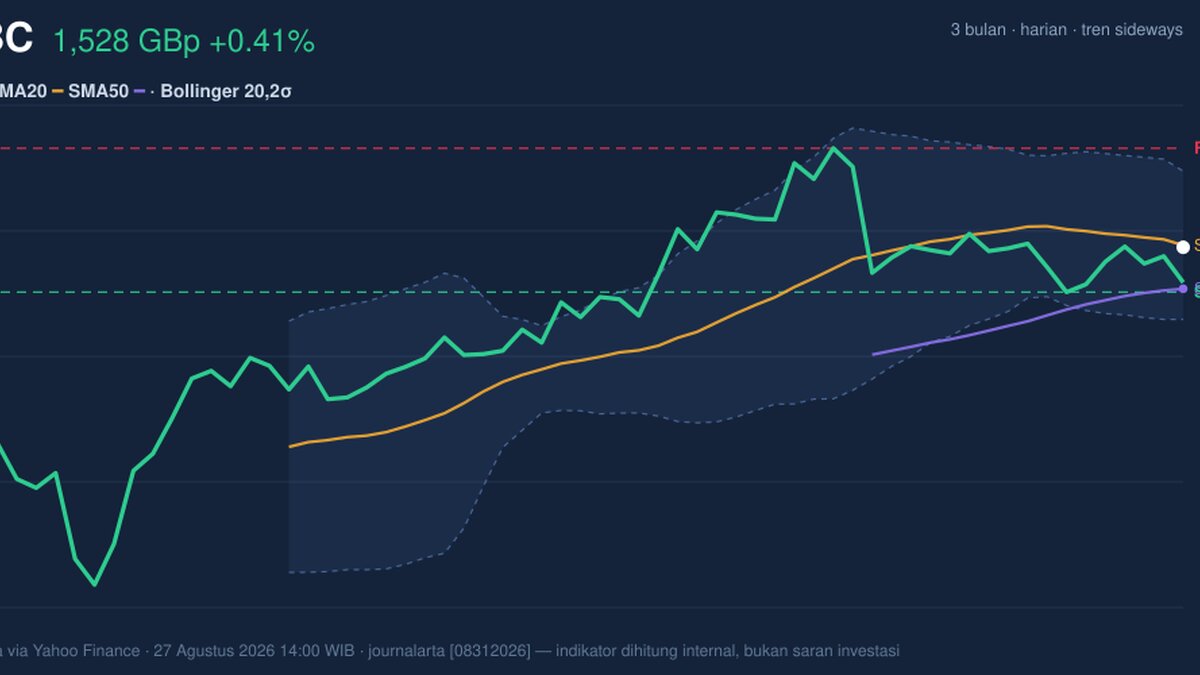
At 1,528.40 GBp on 27 August 2026 at 14:00 WIB, HSBC Holdings is sitting just below its 20-day average of 1,529.85, a small but telling signal that the shares are still trading under near-term pressure even after a 0.41% daily rise. The broader picture is less dramatic: the stock is in a sideways trend, the 20-day moving average is still edging lower, and volume is running at only 0.6× the 20-day average, which says the latest bounce has not yet drawn in the kind of participation usually needed to force a cleaner move.
Trend & Price Action
The chart shows HSBC trying to stabilize inside a fairly tight band rather than breaking into a new trend. Price is trading below SMA20 but above SMA50 at 1,499.56, which places the shares in a middle ground: the short-term tone is softer, but the medium-term base has not failed. That matters because a stock below its fast average but above its slower one is often in a holding pattern, where traders are still waiting to see whether weakness is just a pause or the start of a deeper slide. The moving-average setup is not giving a fresh directional signal. There is no new MA cross, so the chart is missing the kind of cleaner confirmation that usually appears when momentum shifts decisively. Instead, the market is hovering around the Bollinger midline at 1,529.85, which reinforces the idea of consolidation rather than trend acceleration.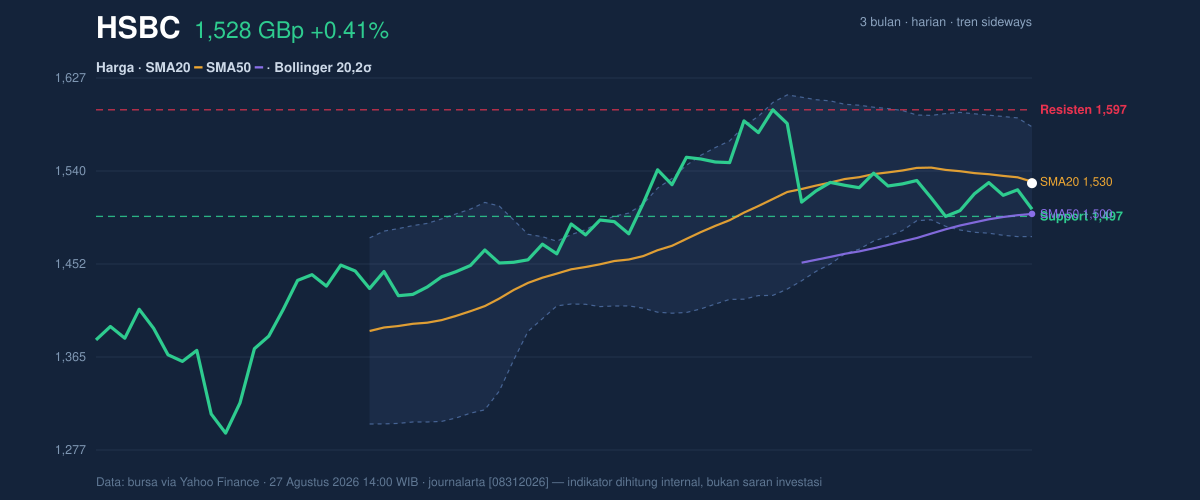
Oscillators & Momentum
The momentum picture is mixed, and that is the key story in the indicators. RSI at 46.3 is neutral, which means the stock is neither stretched nor washed out on that measure. In plain terms, RSI is not warning of a crowded move in either direction. But the stochastic oscillator tells a more immediate story: %K at 17.9 versus %D at 37.5 is in oversold territory, suggesting the recent selloff has already gone far enough to leave the shares vulnerable to a short-term rebound. That rebound signal is not fully confirmed, though, because MACD is still negative. With MACD at 1.805, signal at 6.684, and histogram at -4.879, the momentum line remains below its signal line and the gap is still working against bulls. In practical terms, this means the stock may be oversold on a short-term basis, but the broader momentum engine has not yet turned up.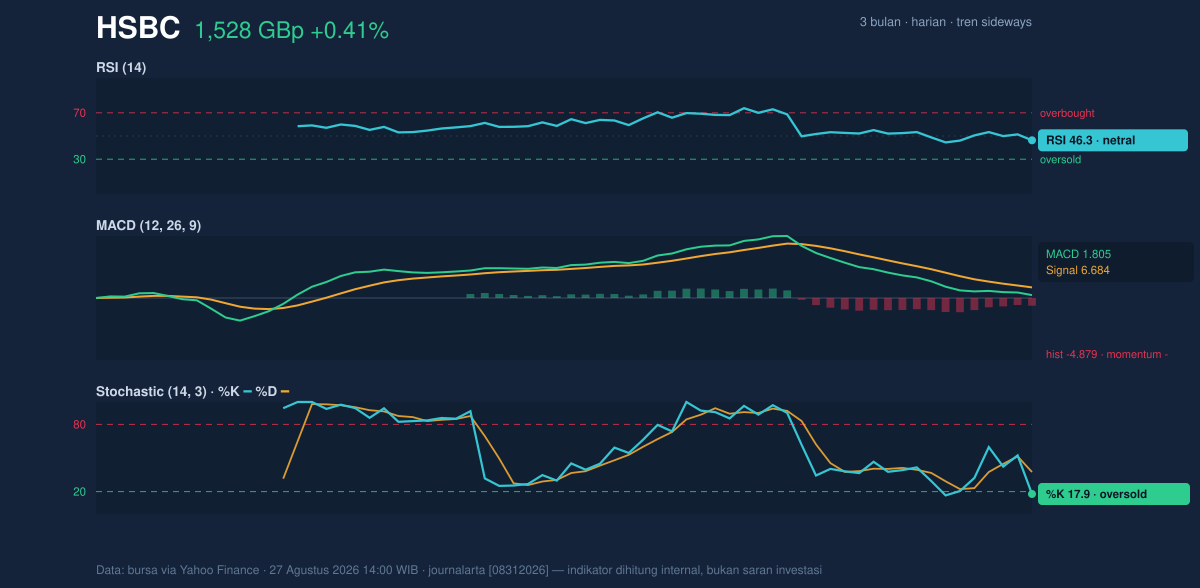
Volatility & Volume
Volatility is unusually restrained for a stock sitting near the middle of its range. The ATR(14) of 22.74, equal to about 1.5% of price, points to relatively low day-to-day movement. That can be read two ways: it reduces the odds of a disorderly selloff in the immediate term, but it also suggests the market has not yet chosen a direction with conviction. The Bollinger Bands add an important nuance. The band width is just 6.8%, and the squeeze suggests compression is building. When bands narrow, price often spends a period coiling before a larger move emerges. The current %B of 49% places HSBC almost exactly in the middle of the band structure, which is another way of saying the stock is not overextended and has not yet broken out of its range. Volume remains the missing ingredient. Last trade volume of 14,858,836 versus a 20-hour average of 26,076,947 shows the move higher has come on light participation. That weak turnover limits the credibility of the bounce. Still, OBV is rising, which is a subtle positive: on-balance volume tracks whether money is accumulating or distributing over time, and a rising line can hint that buyers are quietly stepping in even when the headline volume is not impressive.Key Levels & Scenarios
The chart’s nearest support is 1,497.20, and that level matters because it sits only a little below the current price and aligns with the lower part of the recent range. A failure there would expose the shares to a deeper retest of the lower structure, while a hold would keep the sideways framework intact. Resistance comes in at 1,597.40. That is the first clear ceiling that would need to be cleared before the market could argue that the current squeeze is resolving to the upside. Above that, the 3-month high of 1,610.00 becomes the next obvious reference. HSBC is coiling rather than trending, with weak momentum but a potentially constructive oversold setup. The combination of a sideways trend, price just below SMA20, oversold stochastic, negative MACD, and a Bollinger squeeze points to a market waiting for a catalyst rather than already committing to a direction.Technical Verdict: HOLD (wait & see)
HOLD (wait & see) - RSI at 46.3 is neutral, so there is no strong momentum confirmation either way. - Stochastic %K 17.9 / %D 37.5 is oversold, but MACD histogram -4.879 still shows negative momentum. - Bollinger width of 6.8% suggests compression, but volume at 0.6× the average means the move lacks conviction. - Invalidation: the verdict weakens if price falls below 1,497.20. - Ideal Entry Range: 1,497.20 to 1,529.85 - Exit Target: 1,597.40 - Stop Loss protection: below 1,478.22 In plain English: the shares look like they are pausing near support, but they have not yet proved that the next meaningful move is up. As of 27 August 2026, HSBC’s shares are still trading between 1,497.20 support and 1,597.40 resistance, with volume at 14,858,836 versus a 20-hour average of 26,076,947.Summary Data HSBC
| Last price | 1,528.40 GBp |
| Change 1 day / 5 days / 1 month | 0.41% / 1.72% / -3.69% |
| Trend / MA-cross | sideways / none |
| SMA20 / SMA50 | 1,529.85 / 1,499.56 |
| RSI (14) / Stochastic %K | 46.3 / 17.9 |
| Bollinger %B / ATR | 49% / 22.74 |
| Support / Resistance 20 days | 1,497.20 / 1,597.40 |
| Data as of | 27 Agustus 2026 14:00 WIB |
Track HSBC share price daily: live levels, support/resistance and our full HSBC analysis history.