UOB Death Cross Pressure: Stock Gains 0.34% (Agustus 31, 2026)
On Agustus 31, 2026: price 40.78 SGD, trend downtrend, RSI 41.1, support 40.22, resistance 43.58. technical analysis of uob stock. UOB Death Cross Pressure —…
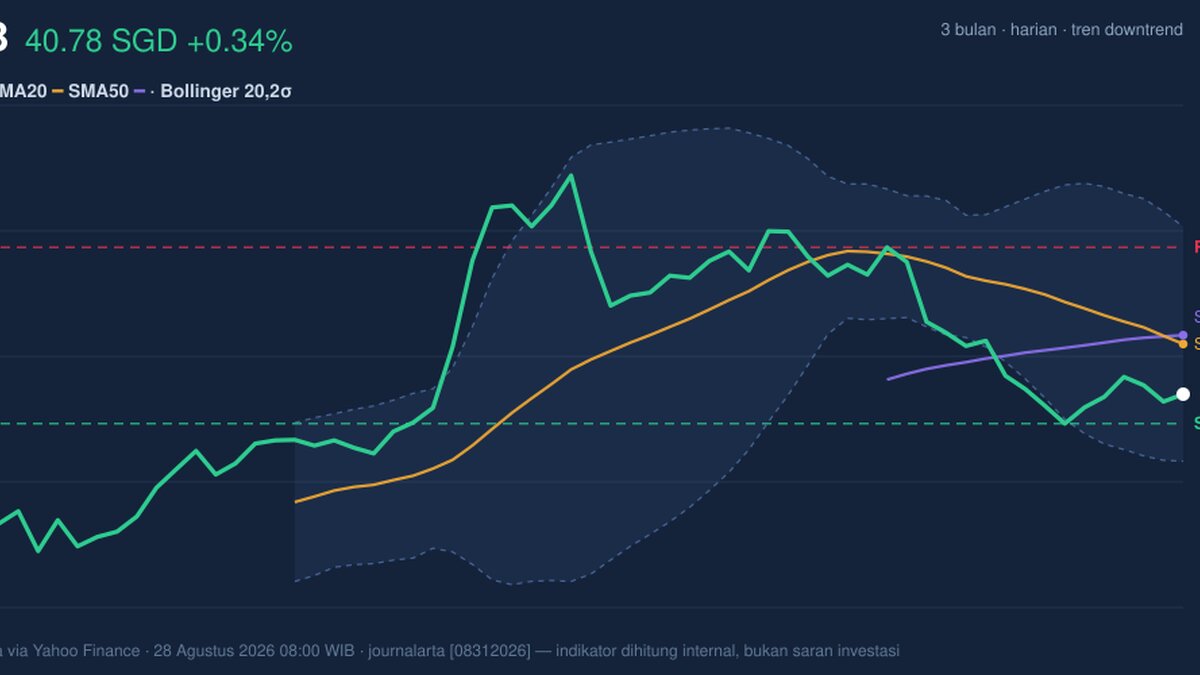
United Overseas Bank slipped to SGD 40.78 on SGX, edging up 0.34% from the previous close but still trading below its short- and medium-term trend markers, according to exchange data cited through Yahoo Finance. The move matters less as a one-day bounce than as a sign of where the stock sits in the larger picture: below its SMA20 at 41.74 and SMA50 at 41.90, with a death cross already in place, the chart is still telling investors that recent weakness has not yet been repaired.
Trend & Price Action
The price structure remains tilted to the downside, and that is reinforced by the downtrend reading and the SMA20 slope of -1.59% over 5 days. In plain terms, the short-term average is falling, so rallies are being treated by the market as pauses rather than a change in direction. That is why the stock’s position below both moving averages matters: it shows UOB is trading under the levels that often act as reference points for trend followers, and it also means the recent rebound has not yet reclaimed control of the chart.
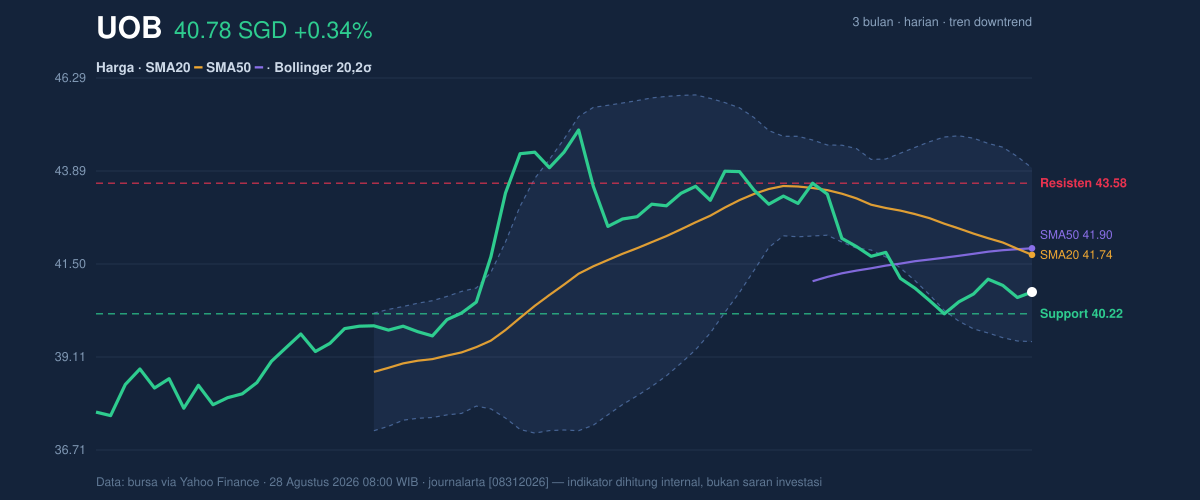
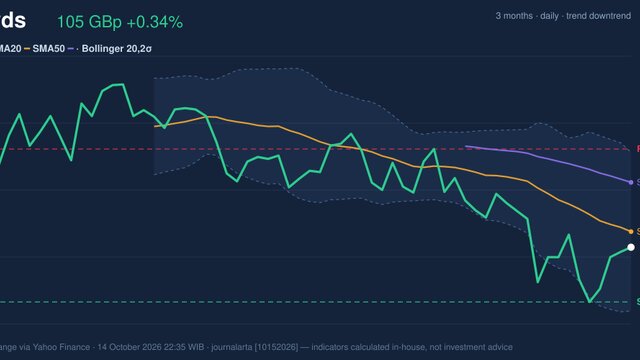
The Bollinger Bands help explain the current setup. UOB is sitting near the lower half of its range, with %B at 29%, which means price is closer to the lower band than the upper band, but not yet stretched to an extreme. The band width of 10.7% is described as normal, so this is not a compression pattern that typically precedes a sharp breakout; instead, it suggests a market that is drifting lower in an orderly way. With the stock at 17% of the 20-day support-resistance range, the market is still leaning toward the lower end of the recent trading band rather than testing the top.
Oscillators & Momentum
Momentum is mixed on the surface, but the underlying message is still cautious. The RSI at 41.1 is neutral, which tells readers the stock is neither washed out nor overheated; it is simply lacking a strong momentum impulse. The Stochastic %K at 29.3 and %D at 27.1 are also neutral, but they sit near the lower end of the scale, which often signals a stock that is weak without yet being oversold enough to force a snapback. In other words, the oscillators are not flashing panic, but they are not confirming strength either.
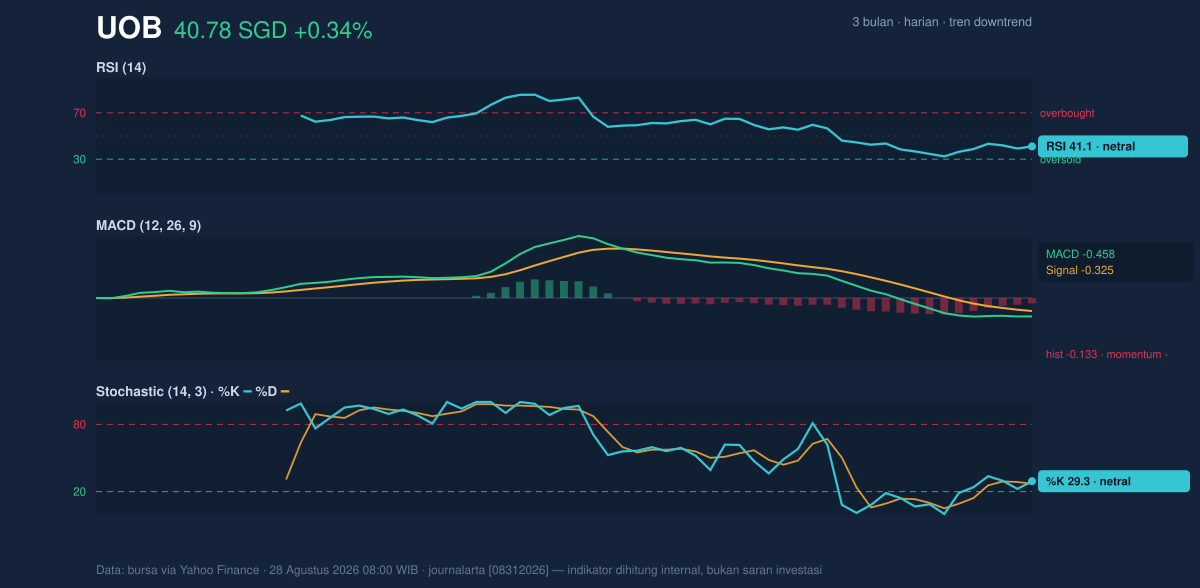
The more important signal is the MACD at -0.458, below its signal line at -0.325 with a negative histogram of -0.133. That combination means downside momentum is still ahead of the trend line, even if the gap is not especially wide. For general readers, MACD is a way of measuring whether recent price action is improving or weakening; here, it says the stock’s short-term energy is still negative, so any bounce has to work against that pressure before it can be seen as more than a temporary recovery.
Volatility & Volume
Volatility is subdued, which usually makes the chart slower to resolve. The ATR at 0.58, equal to 1.4% of price, points to low day-to-day movement. That can mean fewer abrupt swings, but it also means the stock may need a clear catalyst to escape its current range. In that setting, volume becomes especially important as confirmation.
Here, participation looks thin. Last volume was 1,717,900, roughly 0.5x the 20-day average of 3,596,950, and OBV is falling. OBV, or on-balance volume, is a simple way of checking whether money is flowing into or out of a stock; a declining reading suggests sellers have had the better of the tape over time, even if the latest session shows a modest gain. The combination of quiet volume and falling OBV weakens the case that the current bounce is being broadly supported.
Key Levels & Scenarios
The nearest technical floor is support at 40.22, while the first clear ceiling is resistance at 43.58. Those levels matter because they frame the likely short-term debate: whether the recent rebound can gather enough force to recover the middle of the range, or whether it fades back toward support. The stock’s 3-month low at 37.52 remains the deeper downside reference, while the 3-month high at 45.15 marks the upper boundary of the larger range.
If UOB can hold above 40.22 and work back through 41.74 and 41.90, the chart would begin to look less fragile, especially if volume expands and MACD starts to improve. If instead it fails to hold 40.22, the market would likely revisit the lower part of the recent range, with the 37.52 area becoming the next major reference point. As shown in the chart, the stock is still trading closer to support than resistance, which keeps the burden on buyers to prove that the bounce is more than a short-lived pause.
Technical Verdict: HOLD (wait & see)
HOLD (wait & see) fits the current setup because the chart is still in a downtrend, price remains below SMA20 and SMA50, and the MACD is negative. At the same time, RSI and Stochastic are neutral, so the stock is not stretched enough to force a decisive reversal reading. The low ATR and light volume also argue for patience rather than urgency, since there is not yet enough participation to confirm a clean change in direction.
- Ideal Entry Range: 40.22 to 41.74
- Exit Target: 43.58
- Stop Loss protection: below 40.22, with deeper chart risk if 37.52 gives way
This means the stock is still in a repair phase: it has stopped falling for the moment, but it has not yet shown the strength needed to break the downtrend. UOB’s next scheduled market test is whether it can defend 40.22 and reclaim 41.74 on better volume.
Summary Data UOB
| Last price | 40.78 SGD |
| Change 1 day / 5 days / 1 month | 0.34% / 0.62% / -7.06% |
| Trend / MA-cross | downtrend / death |
| SMA20 / SMA50 | 41.74 / 41.90 |
| RSI (14) / Stochastic %K | 41.1 / 29.3 |
| Bollinger %B / ATR | 29% / 0.58 |
| Support / Resistance 20 days | 40.22 / 43.58 |
| Data as of | 28 Agustus 2026 08:00 WIB |
Track UOB share price daily: live levels, support/resistance and our full UOB analysis history.