AstraZeneca Stock Technicals Today: Drops 1.19%, Momentum Gains
On September 1, 2026: price 11,970.00 GBp, trend sideways, RSI 44.8, support 11,460.00, resistance 12,476.00. technical analysis of astrazeneca stock.
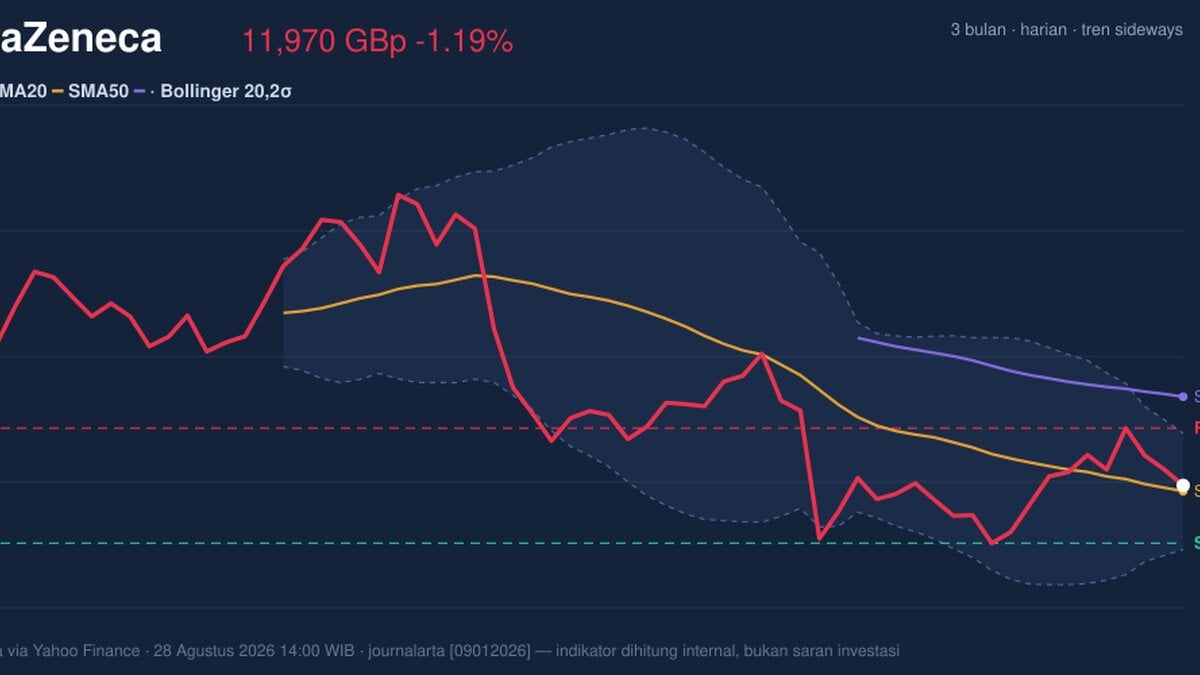
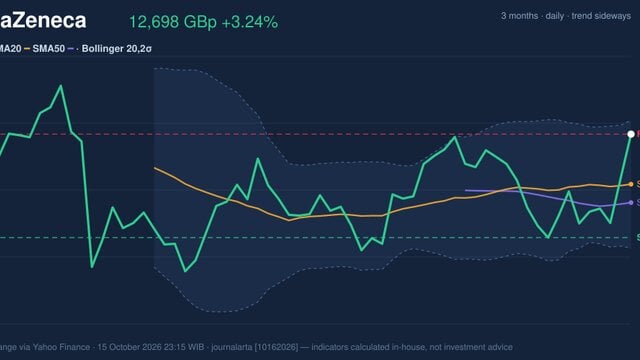
AstraZeneca’s London shares were last quoted at 11,970.00 GBp, down 1.19% on the day, and the tape says the market is still trying to decide whether the recent pullback is a pause inside a broader range or the start of a deeper drift. The stock is sitting just above its SMA20 at 11,918.70, but well below its SMA50 at 12,753.80, which matters because it shows short-term stabilisation without a confirmed medium-term recovery. As shown in the chart, price is parked around the middle of the current band, with no fresh moving-average crossover to suggest a new trend regime.
Trend & Price Action
The broader pattern remains sideways, and the slope of the SMA20 at -1.41% over 5 days shows that the near-term trend is still leaning lower even though price has not broken decisively beneath the short average. That combination usually signals a market that is correcting rather than collapsing: sellers have not fully taken control, but buyers have not yet forced a clean reversal either.
The stock is also down 2.21% over 5 days and 5.24% over 1 month, so the recent weakness is not just a one-session move. At the same time, the 3-month low of 9,892.00 remains intact below current levels, while the 3-month high of 15,126.00 still defines the upper boundary of a much wider trading range. That distance between the current quote and the high is a reminder that the market has not yet rebuilt enough momentum to challenge the prior peak.
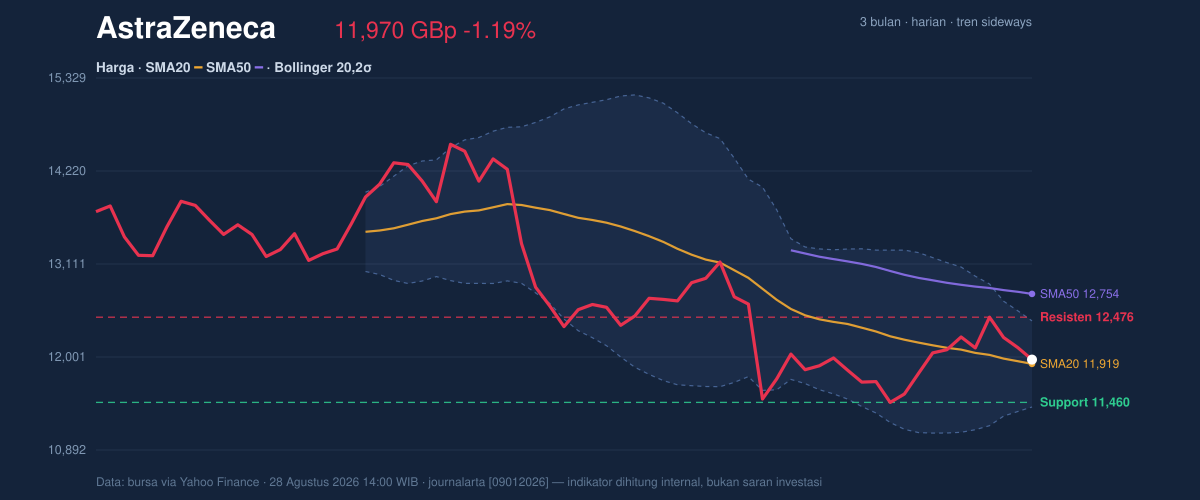
The most important price signal here is that AstraZeneca is trading above the 11,918.70 middle Bollinger band and above the 11,460.00 support, but below the 12,476.00 resistance. In plain terms, the stock has room to recover, but it has not yet proved that demand is strong enough to push through the nearest ceiling.
Oscillators & Momentum
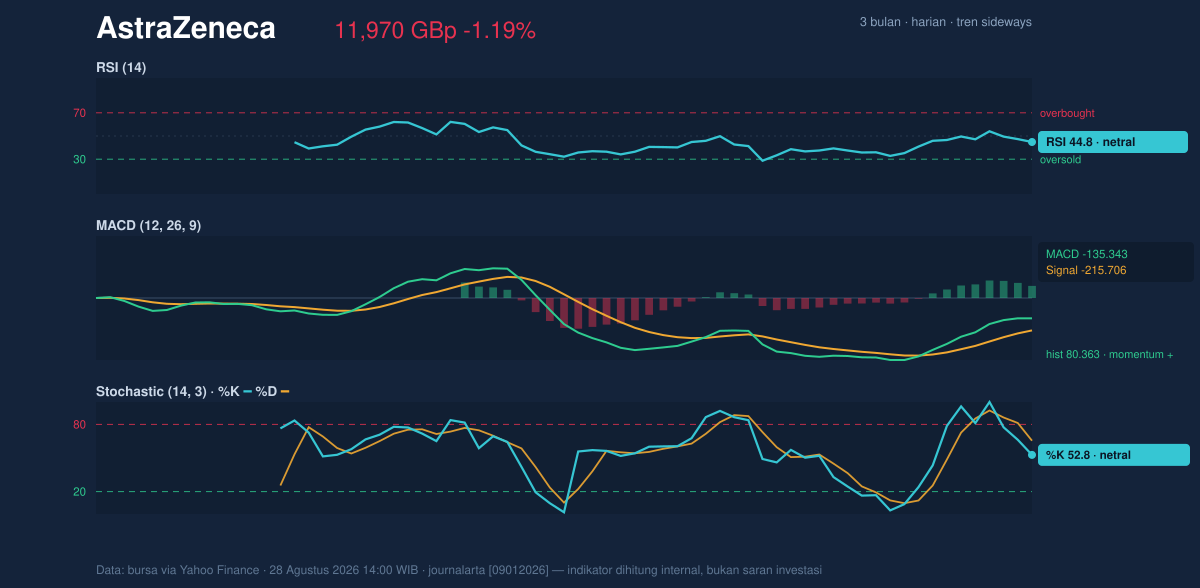
Momentum is mixed, and that is the key reason the chart still looks like a holding pattern rather than a breakout setup. The RSI at 44.8 is neutral, which means the stock is neither oversold enough to imply panic nor strong enough to suggest broad accumulation. The Stochastic %K at 52.8 and %D at 65.5 are also neutral, but the fact that %K sits below %D hints that short-term momentum has not fully turned upward yet.
The more constructive reading comes from the MACD at -135.343, its signal at -215.706, and the histogram at 80.363. A negative MACD line still tells us the trend has not fully repaired, but the positive histogram shows the gap between MACD and signal is improving. In simple terms, the downside momentum is easing even if the trend has not flipped decisively. That is a better signal for stabilisation than for immediate acceleration.
Volatility & Volume
Volatility is not extreme. The ATR(14) at 261.37, equal to 2.2% of price, points to moderate daily movement, while the Bollinger band width of 8.6% is normal rather than compressed or expanded. That matters because a tight squeeze often precedes a sharp move; here, the market does not look primed for an explosive break purely on volatility structure.
The Bollinger position is also balanced. With %B at 55%, the share price is slightly above the midline of the band, which suggests mild recovery pressure but not enough strength to call it overextended. The upper band at 12,431.83 sits just below the chart resistance at 12,476.00, so the stock would need to reclaim both levels to show that buyers are regaining control.
Volume adds a cautionary note. Last volume was 3,627,956, below the 20-day average of 4,338,455, or about 0.8x normal. That means the recent move lower has not been accompanied by heavy participation, which reduces the evidence of aggressive selling. At the same time, OBV is rising, and that is an encouraging divergence: the on-balance volume line suggests money flow has been improving even while price remains subdued. As shown in the chart, that often means accumulation is happening quietly rather than loudly.
Key Levels & Scenarios
The immediate map is clear. 11,460.00 is the first line of defence, and 12,476.00 is the first meaningful barrier. Between those two levels, the stock is essentially range-trading, with the current price near the middle of the band. If price holds above 11,918.70 and then clears 12,431.83, the chart would begin to show a cleaner attempt to retest resistance. If it slips below 11,460.00, the market would be signalling that the recent stabilisation has failed and the lower part of the range is back in play.
Technical Verdict: HOLD (wait & see)
HOLD (wait & see)
- RSI 44.8 and Stochastic 52.8 / 65.5 are neutral, so momentum is not strong enough to confirm a directional break.
- MACD -135.343 remains negative, but the 80.363 histogram shows downside momentum is easing.
- Price is above the SMA20 at 11,918.70 and 11,460.00 support, yet still below the SMA50 at 12,753.80 and near the middle of a range.
Verdict invalidated if price falls below 11,460.00.
- Ideal Entry Range: 11,918.70 to 11,460.00
- Exit Target: 12,431.83 to 12,476.00
- Stop Loss Protection: below 11,405.57
In plain English: AstraZeneca’s chart is steady enough to watch, but not strong enough yet to call a clear turn.
Summary Data AstraZeneca
| Last price | 11,970.00 GBp |
| Change 1 day / 5 days / 1 month | -1.19% / -2.21% / -5.24% |
| Trend / MA-cross | sideways / none |
| SMA20 / SMA50 | 11,918.70 / 12,753.80 |
| RSI (14) / Stochastic %K | 44.8 / 52.8 |
| Bollinger %B / ATR | 55% / 261.37 |
| Support / Resistance 20 days | 11,460.00 / 12,476.00 |
| Data as of | 28 Agustus 2026 14:00 WIB |
Track AstraZeneca share price daily: live levels, support/resistance and our full AstraZeneca analysis history.