Testing Key Resistance, DBS Stock Gains 2.31% Today
On September 1, 2026: price 77.40 SGD, trend uptrend, RSI 58.6, support 73.55, resistance 76.99. technical analysis of dbs stock. Testing Key Resistance — full…
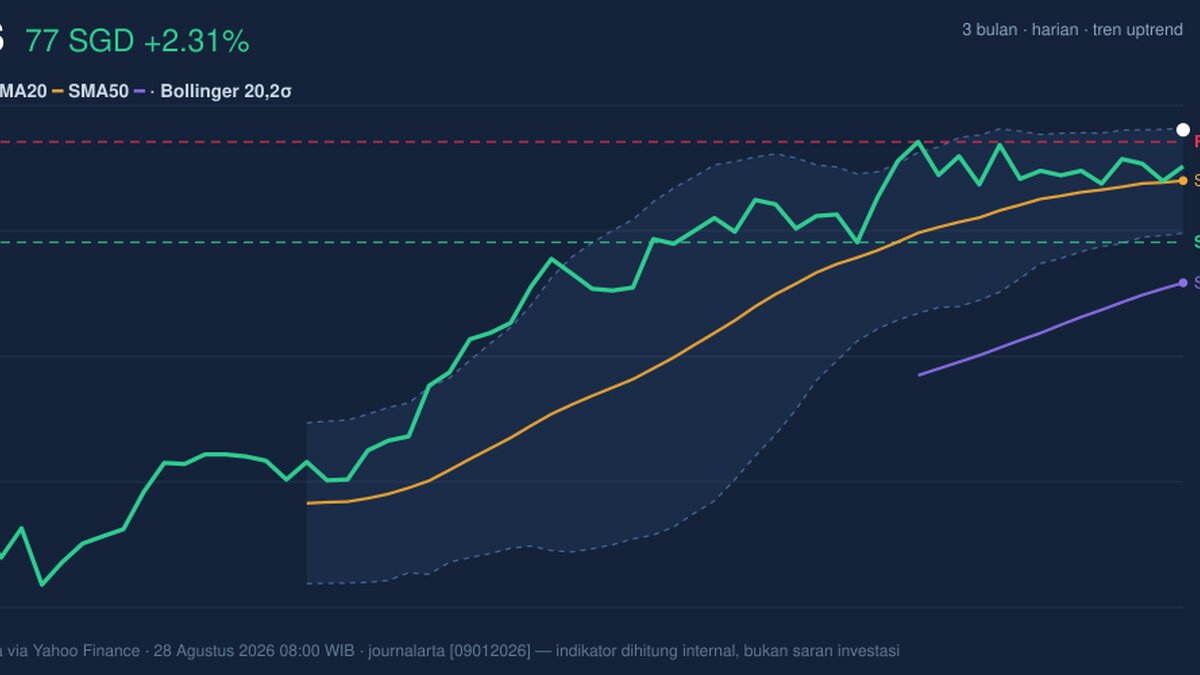
DBS Group’s shares rose to SGD 77.40 on 28 August 2026, up from the previous close of 75.65, extending a short-term advance that has taken the stock to within striking distance of its 3-month high of 77.97. The move matters less for the headline gain than for where it happened: price is now sitting above the 20-day moving average at 75.66 and well above the 50-day moving average at 72.17, which keeps the broader trend pointed higher. But the day’s action also shows a tension that traders watch closely — the shares are pressing against the upper edge of the Bollinger band at 77.46, while momentum indicators are not fully confirming the push.
Trend & Price Action
The chart shows DBS in a constructive trend, with the uptrend supported by the 20-day moving average rising 0.53% over 5 days. That slope is important because it suggests recent gains are being absorbed into the trend rather than standing out as a one-off spike. Price is also above SMA20 and SMA50, a classic sign that buyers still control the medium-term structure. Yet the stock has already moved to 112% of its 20-hour range, with the session’s reference support at 73.55 and resistance at 76.99; in plain terms, it has spent the latest trading window near the top of its range, which usually leaves less room for easy follow-through unless new buying appears.
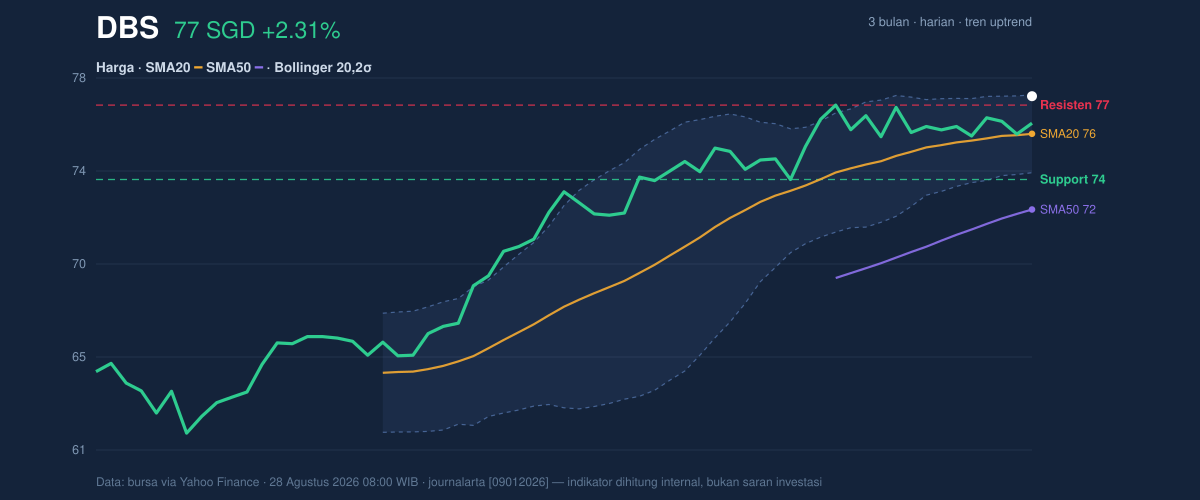
The Bollinger setup adds another layer. With the band width at 4.8% and described as a squeeze, the chart is signalling compressed trading conditions — often the kind that precede a larger move. The catch is that price is already near the upper band at 77.46, so the market is not sitting in the middle of a calm range; it is testing the ceiling of that compression. That can be bullish if volume expands, but it can also invite hesitation if buyers fail to bring conviction.
A tight range rarely stays tight for long.
Oscillators & Momentum
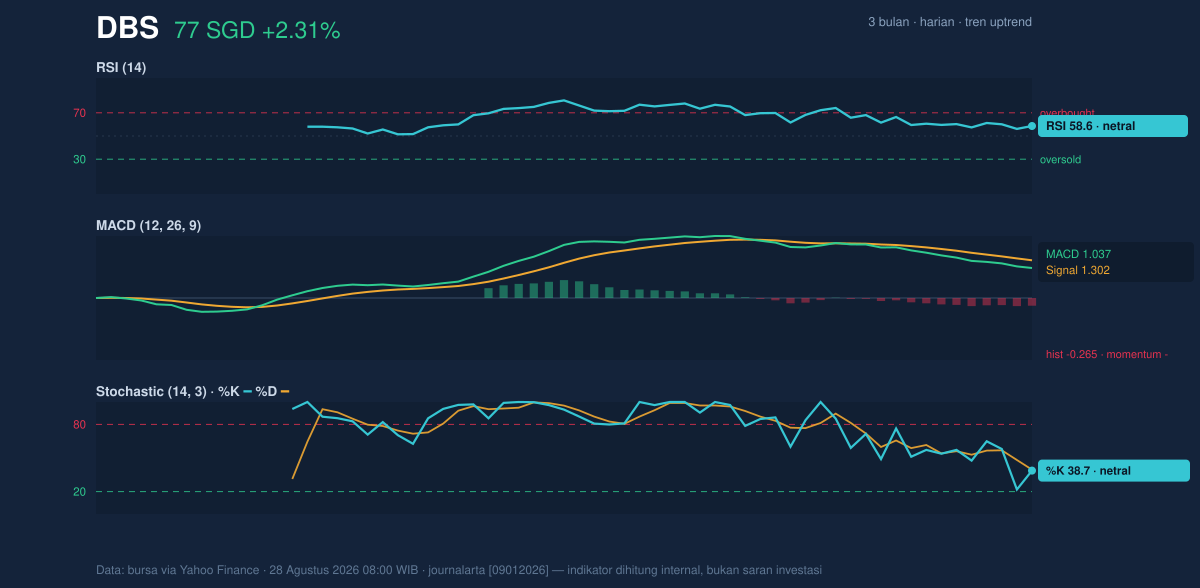
The oscillator picture is more mixed than the trend picture. RSI at 58.6 is neutral, which means the stock is neither clearly overbought nor oversold. That is constructive in one sense: the move has room to continue without immediately running into an exhaustion warning. But the more revealing signal comes from Stochastic %K at 38.7 and %D at 39.5, also neutral and sitting below the midline. Stochastic often reacts faster than RSI, so this positioning suggests the recent upswing has not yet translated into strong short-term momentum.
The clearest caution comes from MACD at 1.037 versus signal at 1.302, with a histogram of -0.265. That negative histogram means the faster line is still below the signal line, a sign that upside acceleration has not fully arrived even though the price trend remains positive. In practical terms, DBS is climbing, but the internal momentum engine is not yet firing at full strength.
That mismatch is the key signal here.
Volatility & Volume
Volatility is moderate, with ATR(14) at 1.19, or about 1.5% of price. ATR measures the average daily trading range, so this reading suggests the stock is not behaving erratically; moves are present, but not extreme. Combined with the Bollinger squeeze, that points to a market that may be preparing for a directional break rather than drifting sideways for long.
Volume, however, is a softer spot. The latest turnover of 2,515,200 was only 0.6× the 20-day average of 4,438,471. In simple terms, the shares rose on lighter participation than usual. That matters because price advances are more convincing when they are backed by broad trading interest. The one supportive counterpoint is that OBV is rising, meaning cumulative volume flow is still leaning positive over time. So while the latest session was quiet, the broader participation trend has not turned against the stock.
Quiet volume on a breakout test is worth watching.
Key Levels & Scenarios
The immediate map is clear. Resistance at 76.99 has already been challenged, and the next visible ceiling is the 3-month high at 77.97. On the downside, the first meaningful floor is the 20-hour support at 73.55, followed by the SMA20 at 75.66, which now acts as a dynamic support line. Because price is near the top of its recent range and close to the upper Bollinger band, the market is at a decision point: hold above the moving average and the range can remain constructive; slip back below it and the current push starts to look more like a failed probe.
Technical Verdict: HOLD (wait & see)
HOLD (wait & see)
- Price is above SMA20 and SMA50, keeping the trend constructive.
- Bollinger bands are squeezed, which raises the odds of a larger move, but the stock is already pressing the upper band at 77.46.
- MACD remains negative versus its signal, so momentum has not fully confirmed the price strength.
- Verdict invalidated if price falls below 73.55, where the nearest support sits.
- Ideal Entry Range: 75.66 to 76.99, where price would be closer to support and the trend line.
- Exit Target: 77.97, the 3-month high.
- Stop Loss protection: 73.55, the 20-hour support.
For non-traders, this means DBS is still in an uptrend, but the next move needs confirmation before the market can prove it is more than a short burst. “We are close to the edge of the range, and the next trade will tell the story.”
Summary Data DBS
| Last price | 77.40 SGD |
| Change 1 day / 5 days / 1 month | 2.31% / 1.84% / 3.41% |
| Trend / MA-cross | uptrend / none |
| SMA20 / SMA50 | 75.66 / 72.17 |
| RSI (14) / Stochastic %K | 58.6 / 38.7 |
| Bollinger %B / ATR | 98% / 1.19 |
| Support / Resistance 20 days | 73.55 / 76.99 |
| Data as of | 28 Agustus 2026 08:00 WIB |
Track DBS share price daily: live levels, support/resistance and our full DBS analysis history.