JPM Stock Gains 1.64%, Testing Key Resistance In Focus
On September 4, 2026: price 362.06 USD, trend sideways, RSI 60.5, support 351.55, resistance 365.18. technical analysis of jpm stock. JPM Stock Gains — full…
By matthew jonathan
September 4, 20265 min read
JPM Stock Gains 1.64%, Testing Key Resistance In Focus
JPMorgan Chase finished at 362.06 USD on 3 September 2026, up 1.64% from the previous close of 356.22. The move keeps the shares near the top of their recent range, but not yet at the ceiling. That matters because JPM is trading in a market that is not in a clean trend, yet is still leaning upward.
Trend & Price Action
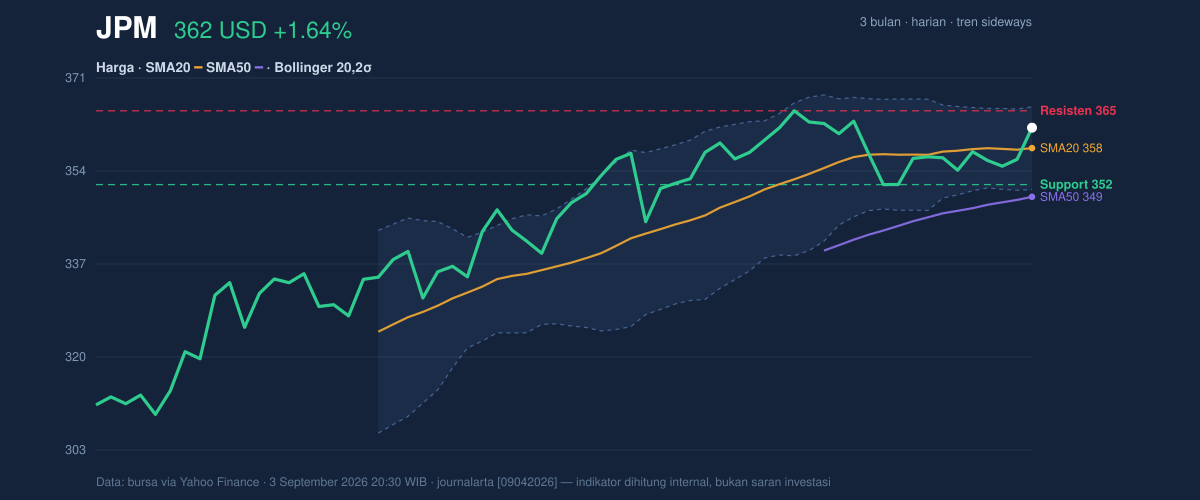
JPM is in a sideways trend, with the SMA20 at 358.29 and the SMA50 at 349.30. The stock sitting above both averages tells you buyers have kept control of the intermediate structure, but the small 0.13% five-day slope in the SMA20 says the advance is not accelerating. In plain terms, the shares are drifting higher rather than breaking out with force.
The absence of a fresh MA-cross means the chart is not giving a new trend signal from the moving averages themselves. Instead, the market is waiting for price to decide whether this is a pause inside an up-tilt or a base before another leg. As shown in the chart, JPM is also trading at roughly 77% of its 20-hour range, which places it closer to resistance than support.
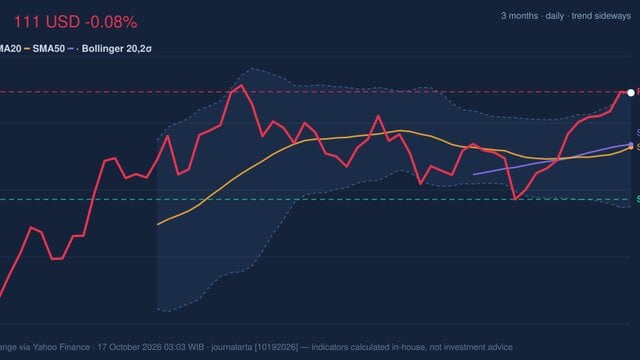
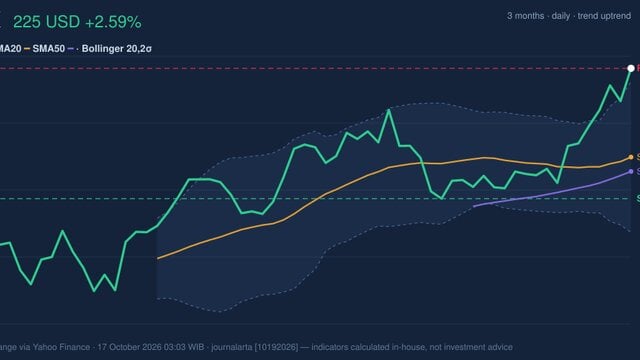
3-month price action chart of JPM: price, SMA20/50, Bollinger, support & resistance. Data: exchange via Yahoo Finance.
The key nearby ceiling is 365.18, with Bollinger upper band at 365.94. That pairing is important: when price approaches both a horizontal resistance and the upper volatility band, it often means the market is testing how much buying power remains. On the downside, 351.55 is the first support to watch, just above the Bollinger lower band at 350.64. A move back toward that area would suggest the recent lift is losing follow-through.
Oscillators & Momentum
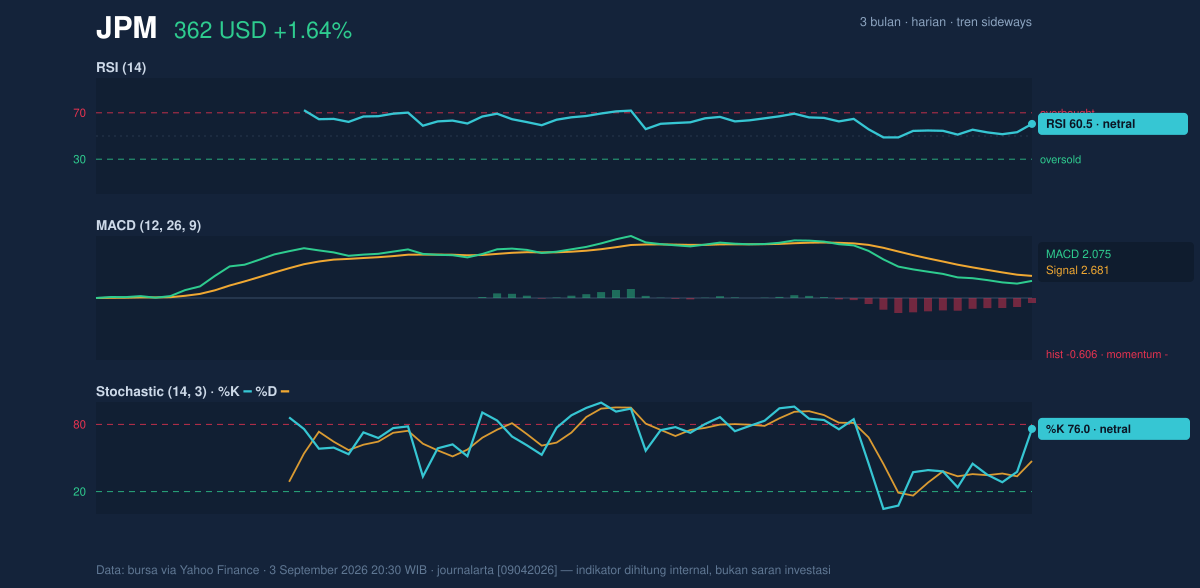
The momentum picture is mixed. RSI at 60.5 is neutral, which means the stock is not stretched enough to signal an obvious overbought condition, but it is firm enough to show persistent demand. The Stochastic %K at 76.0 versus %D at 47.4 is more interesting: %K running well above %D shows short-term price pressure has improved faster than the broader momentum average. That often happens late in a swing, when the stock has already advanced but has not yet confirmed a full trend extension.
However, the MACD at 2.075 remains below the signal line at 2.681, with a -0.606 histogram. That negative histogram is the clearest warning in the data set: the price has been lifting, but the underlying trend impulse is still softer than the recent average. In simple terms, JPM has price strength, but the momentum engine has not fully caught up. As shown in the chart, that kind of divergence can either resolve into a breakout if price pushes through resistance, or fade if the stock loses altitude near the top of the range.
Momentum chart of JPM: RSI(14), MACD, Stochastic. Data: exchange via Yahoo Finance.
Volatility & Volume
The Bollinger Bands are telling a useful story. The 4.3% band width is narrow and described as a squeeze, which usually means the market has compressed into a tighter range and may be preparing for a larger move. A squeeze does not predict direction by itself; it only says volatility has been subdued and a break is becoming more likely. With price at %B 75%, JPM is leaning toward the upper half of that compressed range, which gives the bulls a slight positional advantage.
The ATR(14) at 5.52, or 1.5% of price, indicates volatility is moderate rather than explosive. That matters because a squeeze with only moderate ATR can still produce a gradual breakout, but it can also trap traders in a narrow channel if volume does not expand.
Volume does not yet show a decisive surge. The latest print of 5,414,200 shares is almost exactly in line with the 20-hour average of 5,441,240, or 1.0x normal. That means the day’s gain was not driven by a dramatic flood of participation. Still, OBV is rising, which is constructive because On-Balance Volume tracks whether money flow is accumulating even when headline volume is ordinary. In other words, the stock is not seeing panic buying, but it is seeing enough accumulation to keep the structure intact.
Key Levels & Scenarios
The chart’s main reference points are straightforward: support at 351.55, resistance at 365.18, with the Bollinger envelope at 350.64 to 365.94. JPM is also close to its 3-month high of 366.50, which adds another layer of resistance just above current trade. That combination makes the next move more informative than the last one.
If price clears 365.18 and holds above the upper band near 365.94, the chart would shift from range-bound to breakout watch, because the stock would be moving beyond both horizontal and volatility resistance. If price slips below 351.55, the bullish setup weakens quickly, since that would put the shares back toward the lower band and closer to the middle of the recent structure. The fact that the stock is still above the SMA20 at 358.29 means the short-term trend remains supported for now, but not in a way that rules out a pullback.
Technical Verdict: HOLD (wait & see)
HOLD (wait & see)
- RSI at 60.5 is neutral and does not confirm an overextended move.
- MACD histogram at -0.606 shows momentum is still below its signal line, even as price rises.
- Price above SMA20 and SMA50 is constructive, but the Bollinger squeeze and nearby 365.18 resistance argue for confirmation rather than assumption.
Verdict invalidated if price falls below 351.55.
- Ideal Entry Range: 358.29 to 365.18
- Exit Target: 365.94 to 366.50
- Stop Loss protection: below 351.55
For non-traders: JPM is holding up well, but the chart still needs a clearer move above resistance before the next direction becomes obvious.