META Testing Key Resistance: Stock Gains 3.01% (September 4, 2026)
On September 4, 2026: price 610.68 USD, trend sideways, RSI 60.3, support 543.67, resistance 610.68. technical analysis of meta stock. META Testing Key…
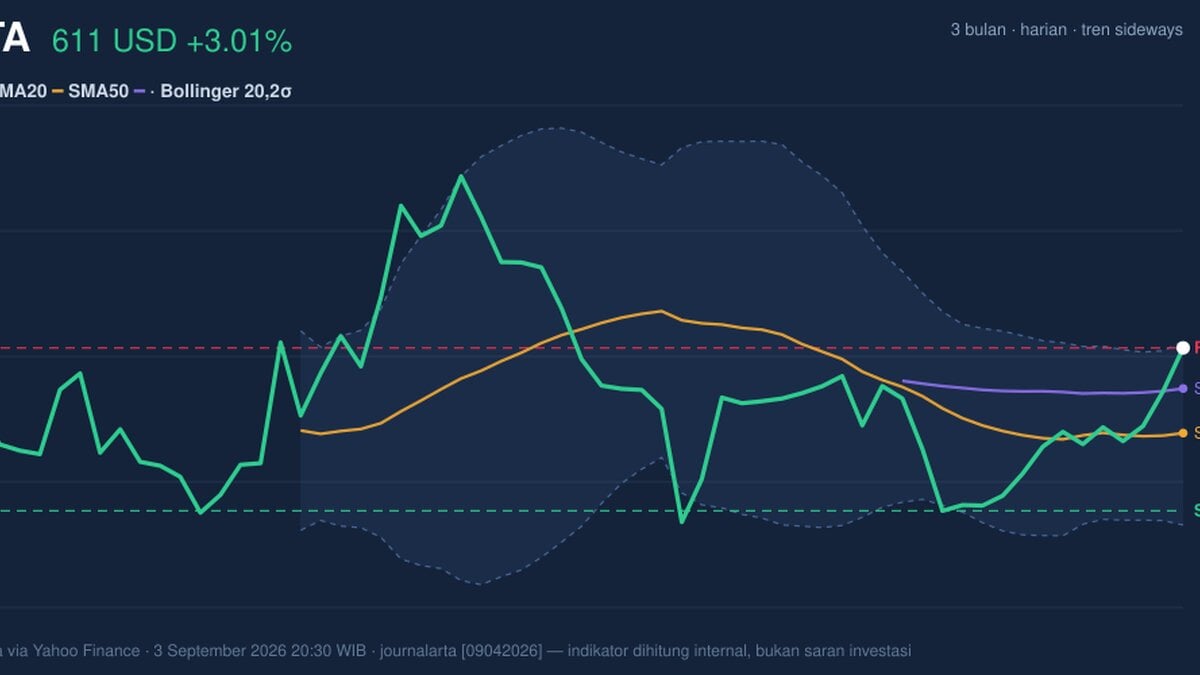
Meta Platforms rose to 610.68 USD on Nasdaq, up 3.01% in the latest session and 6.93% over five days, placing the stock at the top edge of its recent trading range. The move matters because it is not just a one-day bounce: price is now pressing against the upper Bollinger band and sitting above both key moving averages, a combination that usually signals strength — but also a market that is starting to look stretched.
Trend & Price Action
The chart shows Meta trading in a sideways trend, even after the recent push higher, because the slope of the SMA20 is only 0.16% over five days. That is a subtle but important signal: the stock is not in a clean breakout trend, yet it is building pressure above the short-term average rather than slipping back under it. Price is currently above the SMA20 at 575.65 and also above the SMA50 at 594.01, which tells investors that the near-term tone is constructive and that the market has reclaimed both short- and medium-term trend markers.
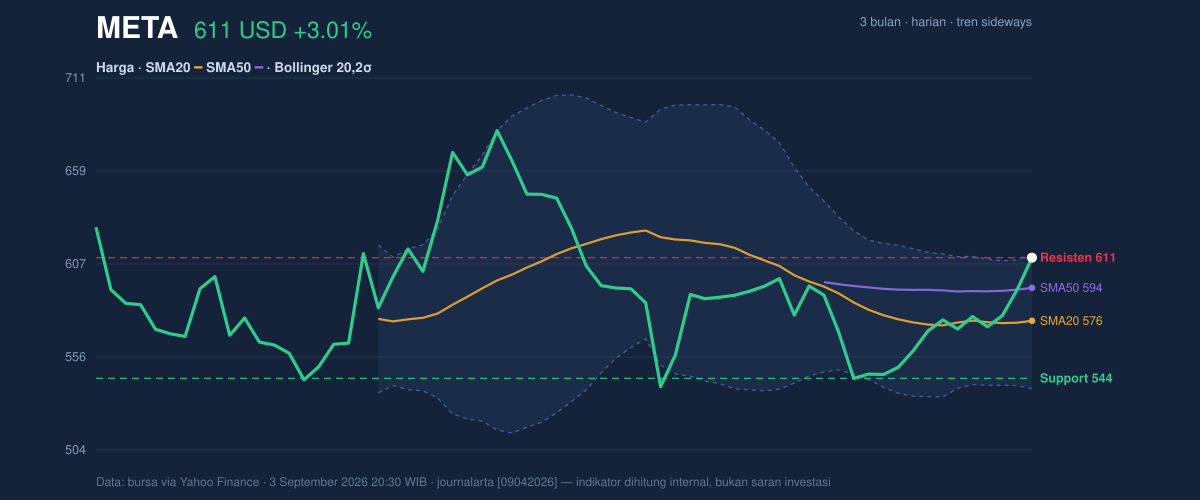
The absence of a fresh MA-cross means the chart has not delivered a new trend confirmation event. In plain terms, this is a stock that has improved, but not one that has fully resolved into a new directional phase. The more telling clue is where price sits in relation to the recent range: Meta is at 100% of the 20-hour range, with support at 543.67 and resistance effectively at the current level, 610.68. That positioning says buyers have pushed the stock to the ceiling of the short-term structure, and any follow-through will need fresh demand rather than just momentum from the prior climb.
The broader 3-month band frames the move neatly. Meta is still below the 3-month high of 686.08 and above the 3-month low of 524.49, which suggests the stock remains in the upper half of its longer recent corridor. That is not breakout territory yet, but it is a healthier location than being pinned near the lows.
Oscillators & Momentum
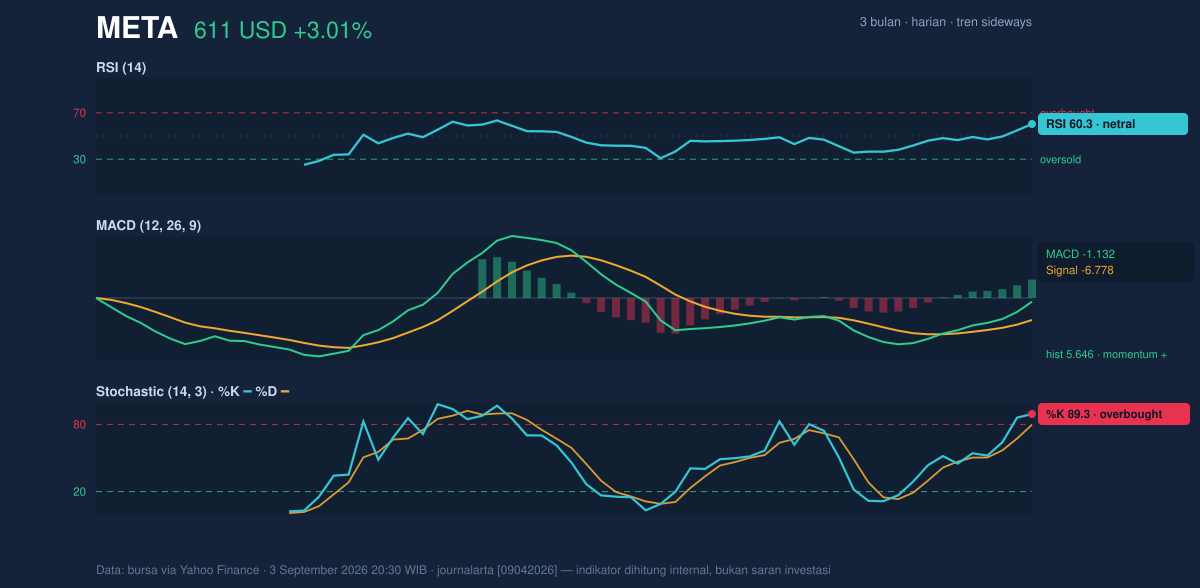
The momentum picture is mixed, and that mix is exactly what makes the current setup interesting. The RSI at 60.3 is neutral, which means the stock is not technically overbought on that measure and still has room to extend if buyers stay engaged. But the Stochastic %K at 89.3 and %D at 79.8 are clearly overbought, showing the latest advance has moved fast enough to leave the short-term oscillator crowded near the top. In practical terms, Stochastic is warning that the stock may need to pause or consolidate before it can continue higher.
The MACD at -1.132 versus its signal line at -6.778 leaves a positive histogram of 5.646, which is the cleaner bullish signal in the set. MACD is often read as trend momentum, and a positive histogram means the gap is improving in favor of buyers even if the absolute MACD line is still below zero. That combination matters: it suggests the stock’s internal momentum is recovering faster than the headline MACD level alone would imply. In other words, the trend is not fully established, but the engine is turning more decisively in the right direction.
Volatility & Volume
Volatility is moderate rather than extreme. The ATR(14) at 19.65, or 3.2% of price, says daily swings are meaningful but not disorderly. That supports a market where breakouts can travel, but where pullbacks can also be swift if momentum cools. The Bollinger Band structure adds another layer: with the upper band at 613.47, the middle at 575.65, and the lower at 537.83, price is now trading very close to the upper boundary, and the %B at 96% shows Meta is near the top of its band envelope. That is a classic sign of strength, but also of compression against resistance; if the stock cannot keep pushing, mean reversion toward the middle band becomes more likely.
The Bollinger width of 13.1% is normal, not squeezed. That matters because there is no sign of a pre-breakout coil that would usually precede a sharp expansion. Instead, the stock is already extended within a standard volatility regime. Volume supports the move, but only moderately: the latest 19,702,000 shares compare with a 20-hour average of 15,768,060, or 1.2x normal. That is enough to validate participation, and the rising OBV confirms accumulation is still present, but it is not the kind of surge that typically accompanies a decisive breakout through resistance.
Key Levels & Scenarios
The immediate technical battleground is straightforward. 610.68 is both the last price and the current resistance line, so the market is testing itself at the point where follow-through must prove durable. Above that, the next reference is the Bollinger upper band at 613.47, which can act like a short-term ceiling. On the downside, 594.01 is the first important moving-average support, followed by the SMA20 at 575.65. If price slips back below the short-term average, the chart would lose some of its immediate bullish tone and likely drift toward the lower band at 537.83 if selling accelerates.
The strongest read is that Meta is in a bullish-but-stretched posture: price is above key averages, momentum is positive, volume confirms participation, and OBV is rising, yet the oscillators are flashing early exhaustion near resistance. That is a setup where continuation is possible, but only if buyers can defend the breakout zone rather than fade it.
Technical Verdict: HOLD (wait & see)
HOLD (wait & see)
- Why: price is above the SMA20 at 575.65 and SMA50 at 594.01, while MACD histogram is positive at 5.646, showing improving momentum.
- Why: volume is 1.2x normal and OBV is rising, which supports the recent advance.
- Why: the stock is also near resistance at 610.68 and the upper Bollinger band at 613.47, while Stochastic is overbought, so upside is not cleanly confirmed yet.
- Verdict invalidated if price breaks below 594.01, because that would put Meta back under the medium-term average and weaken the current bullish structure.
- Ideal Entry Range: 594.01 to 575.65
- Exit Target (Target Price): 613.47 and then 610.68 as the immediate ceiling is cleared
- Stop Loss protection: 575.65, with deeper structural risk below 537.83
For non-traders, this means Meta looks firm, but it is sitting at a point where the market needs to prove the move is real before the next leg can be trusted.
“What happens next at 610.68 will tell us whether this is momentum or just a pause before the stock slips back into range.”
Summary Data META
| Last price | 610.68 USD |
| Change 1 day / 5 days / 1 month | 3.01% / 6.93% / 3.52% |
| Trend / MA-cross | sideways / none |
| SMA20 / SMA50 | 575.65 / 594.01 |
| RSI (14) / Stochastic %K | 60.3 / 89.3 |
| Bollinger %B / ATR | 96% / 19.65 |
| Support / Resistance 20 days | 543.67 / 610.68 |
| Data as of | 3 September 2026 20:30 WIB |
Track META stock price daily: live levels, support/resistance and our full META analysis history.