TSLA Stock Gains 5.42%, Testing Key Resistance In Focus
On September 4, 2026: price 376.37 USD, trend sideways, RSI 60.3, support 327.51, resistance 376.37. technical analysis of tsla stock. TSLA Stock Gains — full…
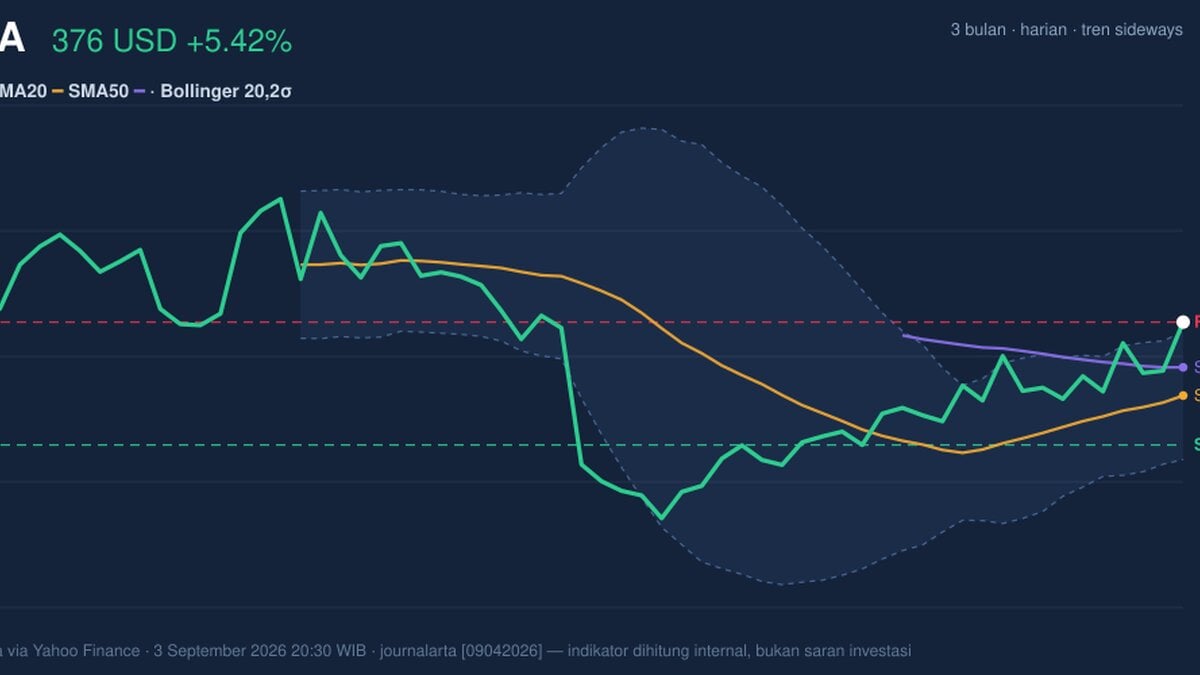
Tesla shares rose on NASDAQ in New York, with TSLA last at 376.37 dollars after a 5.42% one-day gain, extending a 17.79% advance over the past month. The move matters because it pushed the stock to the top of its recent trading band, but the signal is not simply “stronger = better”: the chart now shows a market that is improving on trend and participation, while also becoming stretched in the short term.
Trend & Price Action
The broader pattern is still best described as sideways, even though the latest push has been forceful. The stock is trading above SMA20 at 347.16 and also above SMA50 at 358.37, which tells traders that the shorter-term price has recovered enough to sit above both the medium-term and longer-term average lines. In plain terms, that usually means buyers have regained control of the immediate tape, but not necessarily that a clean new uptrend has fully replaced the prior range.
The absence of a fresh MA-cross is important. A moving-average cross is often treated as a sign that a trend has changed direction; without one, this rally looks more like an extension within an existing structure than a confirmed breakout regime. The SMA20 slope of 3.03% over 5 days shows the short-term trend is tilting upward, but the word “sideways” still fits because the market has not yet escaped the larger range decisively.
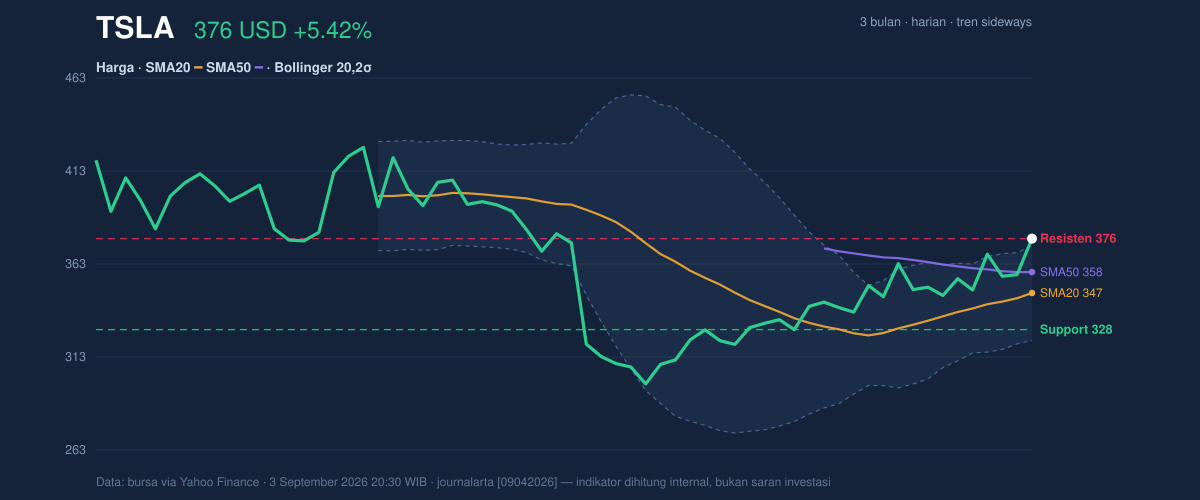
The chart also shows price sitting at 100% of the 20-hour range, with support at 327.51 and resistance at 376.37. That positioning is as bullish as it is fragile: when a stock closes at the top of its range, it can signal momentum, but it also leaves little room for error if buyers step back. The stock is still below the 3-month high of 432.86 and well above the 3-month low of 297.38, which places it in the upper half of the recent multi-month band without yet testing the prior peak.
Oscillators & Momentum
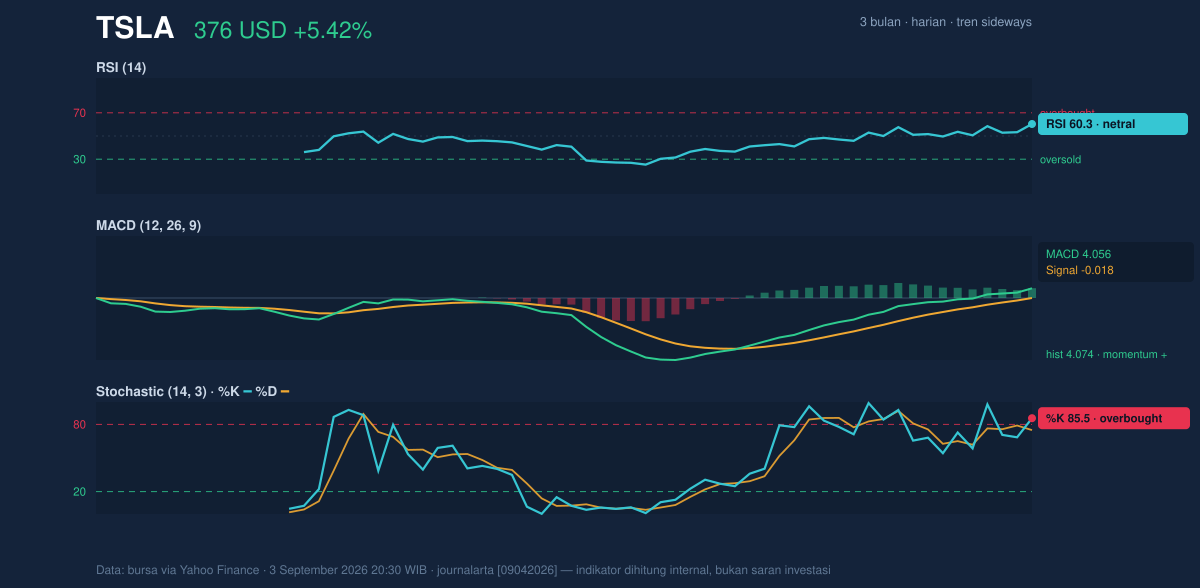
Momentum indicators are telling a more nuanced story than the price alone. The RSI at 60.3 is still neutral, which means the move has not reached a classic overbought extreme on that measure. But the Stochastic %K at 85.5 and %D at 74.9 are already in overbought territory, suggesting the stock is running hot over the very short term and may be vulnerable to pauses or pullbacks if momentum cools.
That difference between RSI and Stochastic is useful. RSI tends to smooth out the move and often reflects broader momentum, while Stochastic reacts faster to recent closes. Here, RSI says the rally has room to breathe, but Stochastic says the stock may have moved too far too fast in the near term. The MACD at 4.056, with a signal line at -0.018 and a histogram of 4.074, is the clearest bullish confirmation in the set. A positive histogram means the faster trend line is above the slower signal line by a meaningful margin, which usually indicates that upward momentum is still expanding rather than fading.
Volatility & Volume
Volatility is elevated. The ATR at 14.12, equal to 3.8% of price, says daily swings are large enough that small changes in sentiment can quickly become material price moves. That matters because a stock trading near resistance with high ATR can break higher abruptly — or reverse just as quickly if buyers lose conviction.
The Bollinger Bands add another layer. Price is above the upper band at 372.66, with %B at 107% and a normal band width of 14.7%. Being above the upper band does not automatically mean a reversal is imminent, but it does mean the stock has moved beyond its recent statistical envelope. In practical terms, the market is pricing in stronger-than-usual enthusiasm, and that often comes with a higher chance of consolidation. The fact that band width is still normal, rather than compressed, suggests this is not a quiet squeeze waiting to explode; it is already in motion.
Volume confirms that the move has real participation behind it. 63,185,000 shares traded versus a 20-hour average of 36,659,735, or about a 1.7× jump. That is meaningful because breakouts without volume often fail; here, trading activity rose alongside price, which improves the credibility of the advance. OBV is rising as well, reinforcing the idea that money flow has been accumulating rather than fading into the rally.
Key Levels & Scenarios
The immediate map is straightforward. 376.37 is now the critical near-term ceiling because it marks both the latest print and the top of the 20-hour range. Above that, the next reference is the broader 3-month high at 432.86. On the downside, 372.66 is the upper Bollinger band and the first place where momentum could cool; beneath that, the market would likely look toward 358.37 at SMA50, then 347.16 at SMA20, and finally 327.51 as the nearest stated support.
If price holds above the upper band and continues to attract volume, the chart would be confirming that buyers are willing to pay up for momentum. If it slips back below 372.66 and then loses 358.37, the message changes: the move would start to look like a stretched rally inside a broader range rather than a sustained breakout. Because Stochastic is overbought while MACD remains positive, the balance of evidence points to strength with a warning label rather than a clean, low-risk trend extension.
Technical Verdict: HOLD (wait & see)
HOLD (wait & see)
- Reason 1: MACD is positive and the histogram is strongly above zero, which supports the current upside impulse.
- Reason 2: Price is above SMA20 and SMA50, showing the stock has recovered above key trend references.
- Reason 3: Stochastic is overbought and price is above the upper Bollinger band, which warns that the move is extended in the short term.
- Verdict invalidated if price breaks below 327.51, the nearest stated support.
- Ideal Entry Range: 358.37 to 372.66
- Exit Target: 376.37, with the next chart reference at 432.86
- Stop Loss Protection: 327.51
In plain English: Tesla’s chart looks strong, but it is already stretched enough that the next move matters more than the last one.
Summary Data TSLA
| Last price | 376.37 USD |
| Change 1 day / 5 days / 1 month | 5.42% / 6.08% / 17.79% |
| Trend / MA-cross | sideways / none |
| SMA20 / SMA50 | 347.16 / 358.37 |
| RSI (14) / Stochastic %K | 60.3 / 85.5 |
| Bollinger %B / ATR | 107% / 14.12 |
| Support / Resistance 20 days | 327.51 / 376.37 |
| Data as of | 3 September 2026 20:30 WIB |
Track TSLA stock price daily: live levels, support/resistance and our full TSLA analysis history.