WMT Stock Gains 2.20% Today, Momentum Weakens
On September 4, 2026: price 108.42 USD, trend downtrend, RSI 48.9, support 102.63, resistance 116.01. technical analysis of wmt stock. WMT Stock Gains — full…
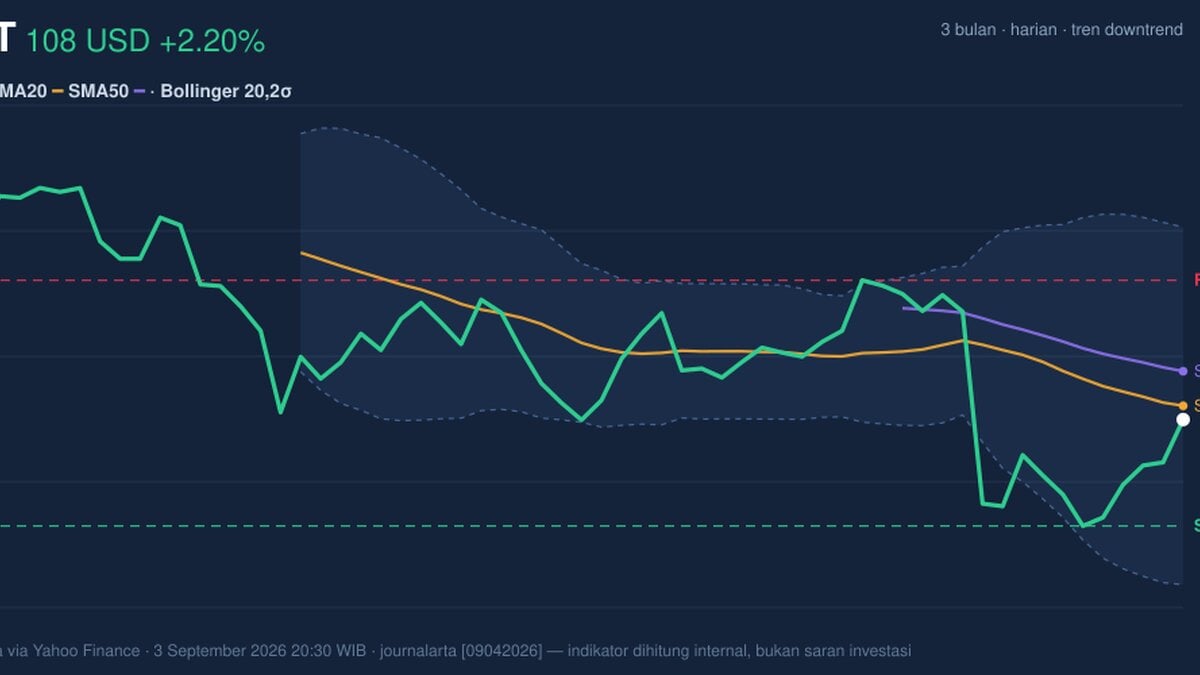
Walmart is holding above a key three-month floor, but the tape still shows a stock fighting its own trend rather than one in clear command. On the New York Stock Exchange, WMT last traded at 108.42 USD, up 2.20% on the day and 5.64% over five days, yet still 3.26% lower over one month, a combination that usually signals a short rebound inside a broader soft patch.
Trend & Price Action
The most important message in the chart is not the one-day gain; it is that price remains below the 20-day SMA at 109.17 and below the 50-day SMA at 111.06. That matters because moving averages are a simple way to show whether buyers have been able to keep the stock above its recent average cost. When price sits under both, rallies tend to be treated as tests of supply rather than proof of a new advance.
The slope of the SMA20 is down 1.33% over five days, which reinforces the same point. A falling short-term average tells traders the recent direction of travel is still lower, even if the latest session was positive. There is also no fresh MA-cross, so the chart has not produced a new technical turning point that would normally suggest a cleaner trend change.
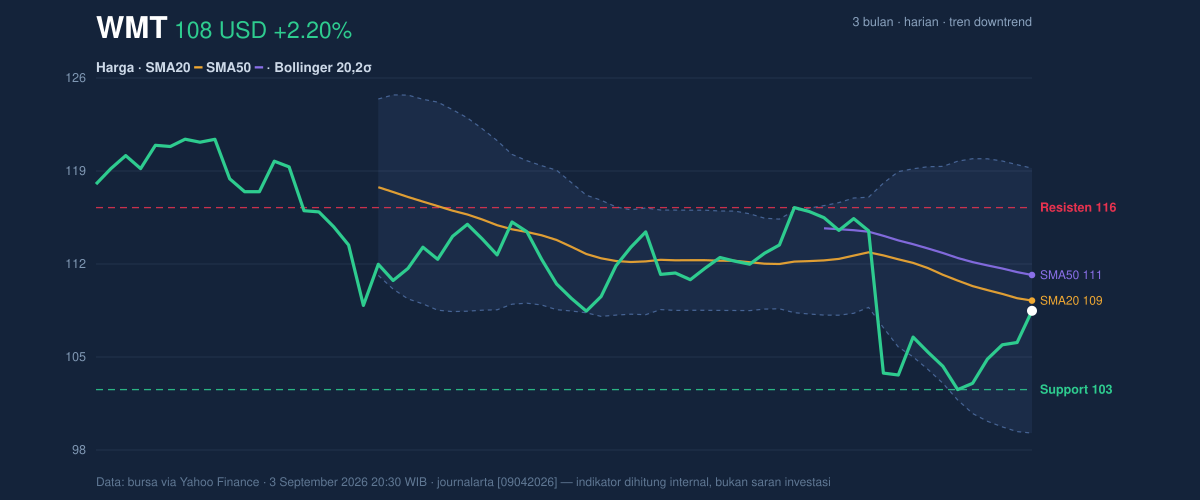
Walmart is trading at 43% of its 20-hour range, with support at 102.63 and resistance at 116.01. That positioning is useful: the stock is not pressing the top of the range, but it is also not collapsing into the lower boundary. In plain terms, the market is still pricing in a wait-and-see phase, where both buyers and sellers have room to argue.
The broader three-month band adds another layer. The stock’s 3-month high is 122.94 and the 3-month low is 102.15. Since price is closer to the lower end than the upper end, the chart still leans defensive. The latest bounce has improved the tone, but it has not yet repaired the longer structure.
Oscillators & Momentum
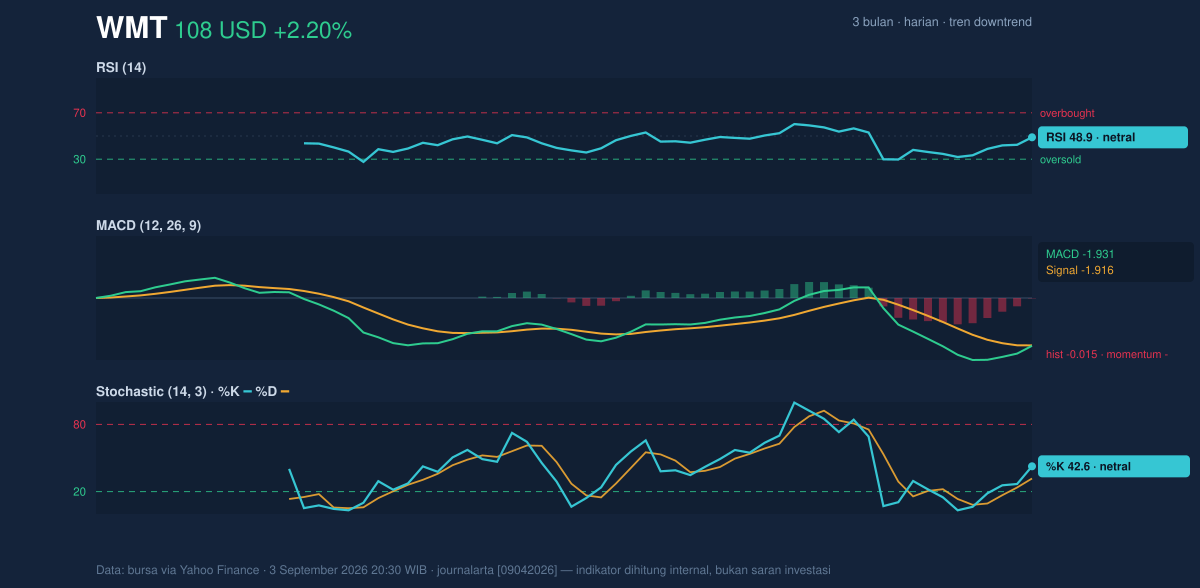
Momentum is not confirming a strong directional move. The RSI at 48.9 is neutral, which means the stock is neither stretched on the upside nor washed out on the downside. That is important because a neutral RSI often appears when a stock is pausing after a selloff or consolidating before deciding its next move. It does not, by itself, argue for a breakout.
The Stochastic oscillator shows %K at 42.6 and %D at 31.7, also neutral. Stochastic is often used to show whether short-term momentum is accelerating or fading. Here, the reading says the stock has recovered from weaker levels, but not enough to signal a fully restored trend. The fact that %K sits above %D is mildly constructive, yet the gap is not wide enough to call it decisive.
The clearest momentum warning comes from the MACD at -1.931, with the signal line at -1.916 and a histogram of -0.015. MACD below zero means the shorter-term trend is still weaker than the longer-term one. The histogram near flat shows that bearish pressure is not aggressive, but it is still present. That combination usually describes a market that is losing downside speed, not one that has already turned higher in a confirmed way.
Volatility & Volume
The Bollinger Bands help explain why the recent move can be read as recovery rather than breakout. With %B at 46% and the middle band at 109.17, price is sitting just under the center of the band structure. In simple terms, the stock is near the middle of its recent trading envelope, not near the upper edge where momentum breakouts tend to be more convincing. The band width of 17.8% is normal, so there is no squeeze suggesting an imminent explosive move.
Volatility is present, but not extreme. The ATR at 2.75, or 2.5% of price, indicates a moderate daily range. That means traders should expect movement, but not the kind of dislocation that typically accompanies a major event shock. The latest session’s volume of 25,510,700 was 0.9x normal versus the 20-session average of 27,839,870. That is slightly light participation for a rally day, so the advance has not yet been backed by unusually strong conviction.
One encouraging detail is that OBV is rising. On-balance volume tracks whether volume is accumulating on up days or distributing on down days. A rising OBV while price is still below short-term averages suggests some buyers are quietly returning, even if the broader trend has not yet flipped.
Key Levels & Scenarios
The near-term map is straightforward. 102.63 is the first support to watch, and the 102.15 three-month low is the deeper floor beneath it. On the upside, 109.17 is the first technical checkpoint because it is the 20-day SMA and Bollinger middle band, while 111.06 is the next hurdle. Above that, 116.01 is the range resistance that would need to give way before the chart starts to look materially stronger.
If price holds above 102.63 and can reclaim 109.17, the stock would be showing that the latest rebound is doing more than just bouncing inside a downtrend. If it fails below 102.63, the market would be warning that the recent support shelf is weakening and the three-month low at 102.15 may come back into focus.
Technical Verdict: HOLD (wait & see)
HOLD (wait & see) fits the chart because the stock has recovered, but the trend has not fully reversed.
- Reason 1: Price is still below the 20-day SMA at 109.17 and below the 50-day SMA at 111.06, so the structure remains under pressure.
- Reason 2: MACD is negative and the histogram is near flat, which says bearish momentum is fading but not yet gone.
- Reason 3: RSI at 48.9, Stochastic at 42.6/31.7, and normal Bollinger width all point to consolidation rather than a decisive breakout.
- Verdict invalidated if price breaks below 102.63, because that would weaken the current support base and bring the 102.15 low into play.
- Ideal Entry Range: 102.63 to 109.17, where support can be tested and the first reclaim of the short-term average would matter.
- Exit Target: 111.06 to 116.01, using the 50-day SMA and range resistance as the next technical checkpoints.
- Stop Loss protection: below 102.15, since that is the nearest three-month floor in the data.
In plain English, the chart says Walmart has stopped sliding for now, but it has not yet done enough to prove the recovery is real.
Summary Data WMT
| Last price | 108.42 USD |
| Change 1 day / 5 days / 1 month | 2.20% / 5.64% / -3.26% |
| Trend / MA-cross | downtrend / none |
| SMA20 / SMA50 | 109.17 / 111.06 |
| RSI (14) / Stochastic %K | 48.9 / 42.6 |
| Bollinger %B / ATR | 46% / 2.75 |
| Support / Resistance 20 days | 102.63 / 116.01 |
| Data as of | 3 September 2026 20:30 WIB |
Track WMT stock price daily: live levels, support/resistance and our full WMT analysis history.