CRM Stock Drops 1.97% Today, RSI Overbought
On September 8, 2026: price 259.23 USD, trend uptrend, RSI 76.4, support 190.97, resistance 264.43. technical analysis of crm stock. CRM Stock Drops — full…
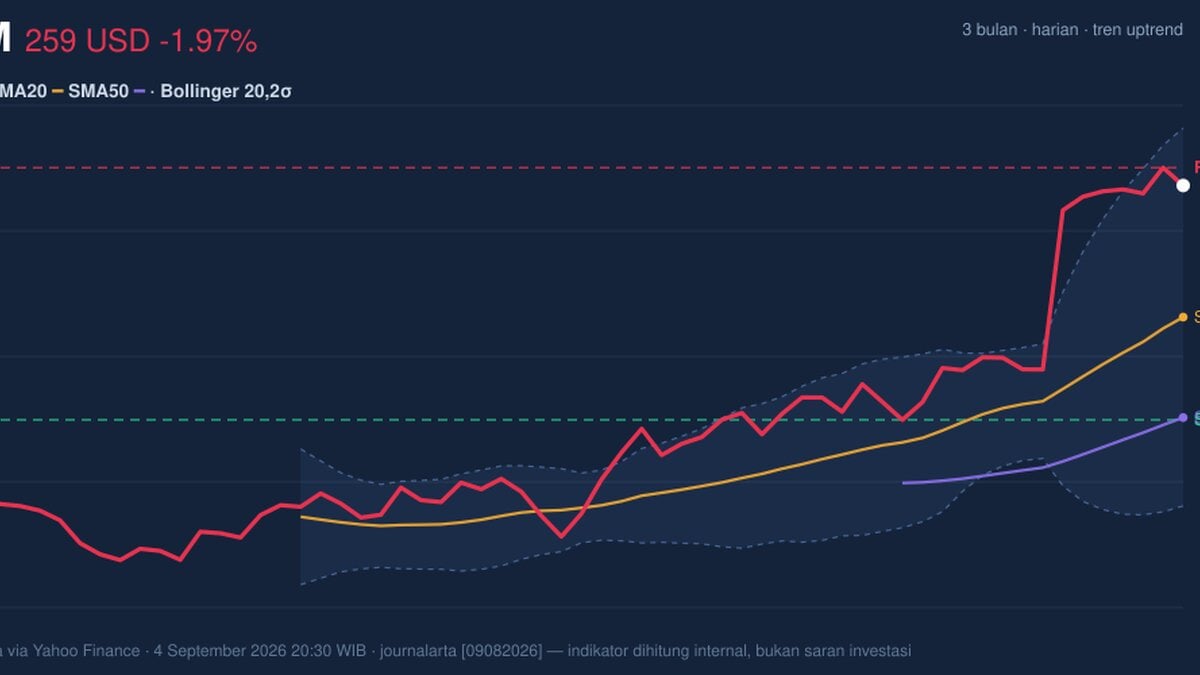
Salesforce (CRM) fell to 259.23 USD on the NYSE, down 1.97% from the previous close, even as the stock remains in a strong uptrend and sits near the top of its recent trading range. The move matters because it shows a stock that is still being bid aggressively over the medium term, but is now trading in a zone where momentum is stretched and short-term traders may be more selective.
Trend & Price Action
The broader structure remains constructive. Salesforce is trading above its SMA20 at 220.92 and well above its SMA50 at 191.65, which means the current price is still sitting above both short- and medium-term trend markers. In plain terms, the market is still rewarding buyers who stepped in earlier, and the slope of the SMA20 is rising 8.52% over 5 days, reinforcing that the trend is not just intact but accelerating.
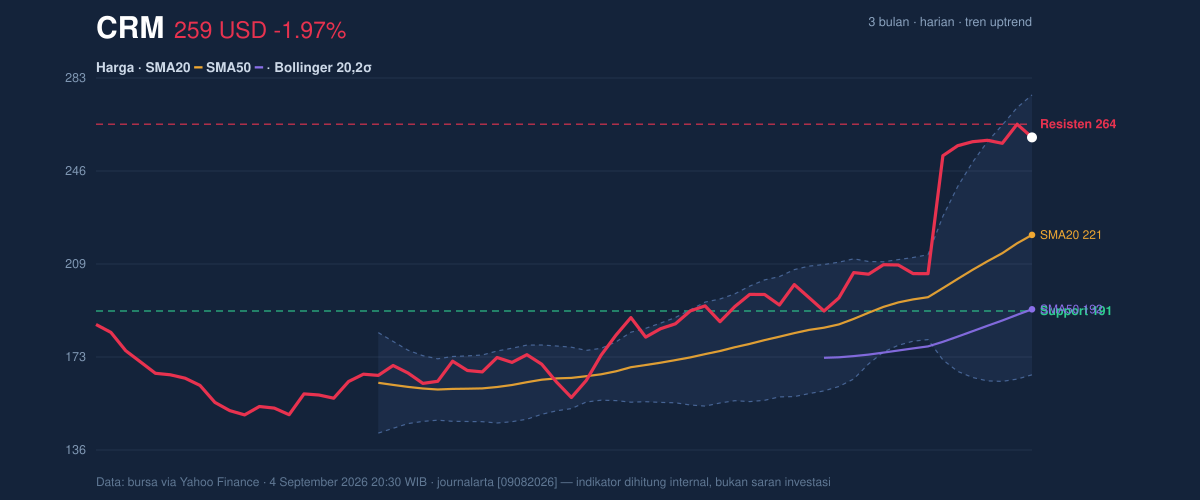
The chart also shows the stock at 93% of its 20-hour range, with the last price below the most recent 20-hour resistance at 264.43 but far above 20-hour support at 190.97. That positioning suggests the market is pressing against the upper end of the range rather than building a base in the middle. The 3-month high at 268.27 is now close enough to matter: it is the next obvious ceiling, and a move through that area would indicate the rally is extending into fresh territory. The absence of a new MA-cross tells us the trend is being carried by price strength rather than a fresh moving-average signal.
Oscillators & Momentum
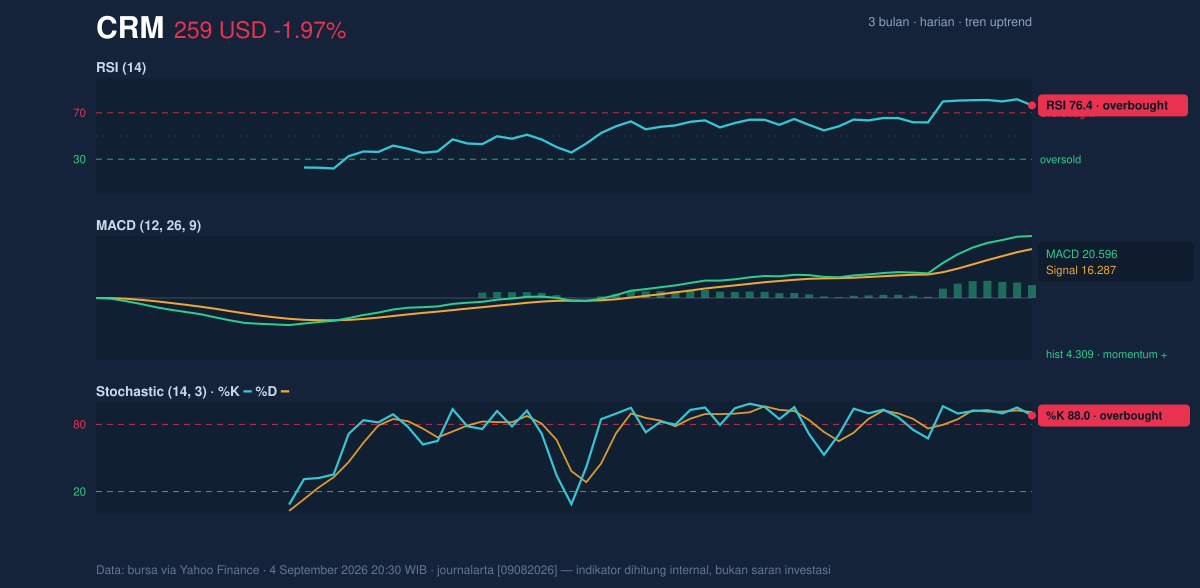
Momentum is positive, but it is also overheated. The RSI at 76.4 and the Stochastic %K at 88.0 / %D at 90.9 both sit in overbought territory, which means the stock has risen fast enough that short-term gains may have become crowded. Overbought does not automatically mean a reversal, but it does mean the market is vulnerable to pauses, pullbacks, or a period of sideways consolidation if fresh buyers do not keep arriving.
The MACD at 20.596, above its signal line at 16.287, with a positive histogram of 4.309, says the trend still has upward force behind it. This is important: momentum indicators are not all flashing the same warning. RSI and Stochastic are saying the move is extended, while MACD is saying the underlying trend is still pushing higher. That combination often appears late in a rally, when price can continue rising but becomes more sensitive to any disappointment.
Volatility & Volume
Volatility is elevated. The Bollinger Band width of 49.8% is widening, and ATR(14) at 11.46 represents 4.4% of price, which means daily swings can remain large even without a major change in trend. The price is also sitting at %B 85%, near the upper Bollinger Band at 275.96. That tells us the stock is trading toward the top of its expected volatility envelope, a sign of strength but also a sign that upside may become harder to sustain without a pause.
Volume adds a more nuanced signal. The latest turnover was 10,490,600, below the 20-day average of 16,432,265, or about 0.6× normal. In practical terms, the stock is rising on less-than-average participation, which can mean the move is being driven by a narrower group of traders rather than broad conviction. That does not negate the uptrend, but it does reduce confidence that the latest push has the same force as a breakout backed by heavy volume. OBV, however, is still rising, which suggests that despite the softer daily volume, the broader flow of shares has continued to favor accumulation over distribution.
Key Levels & Scenarios
The nearest resistance remains 264.43, with the 3-month high at 268.27 just above it. Those levels matter because the stock is already close enough that any renewed buying could test them quickly. Above that zone, the upper Bollinger Band at 275.96 becomes the next technical reference, not as a forecast, but as the top of the current statistical range.
On the downside, the first meaningful cushion is the SMA20 at 220.92, which now doubles as the Bollinger middle band. If price slips below that area, it would suggest the recent surge is losing its immediate momentum and reverting toward a more balanced trading band. The deeper structural floor is support at 190.97, and a break there would weaken the broader trend more seriously because it would place the stock back into the lower part of its recent range.
Technical Verdict: HOLD (wait & see)
HOLD (wait & see)
- RSI 76.4 and Stochastic 88.0 / 90.9 show the stock is overbought, so the short-term move is stretched.
- MACD 20.596 above signal 16.287 and a positive histogram keep the trend bullish, so momentum has not fully rolled over.
- Price above SMA20 220.92 and SMA50 191.65, with rising SMA20 slope, confirms the larger uptrend is still intact.
Verdict invalidated if price falls below 220.92, which would mean the stock has lost its nearest trend support.
- Ideal Entry Range: 220.92 to 235.00, where price would be closer to the trend base rather than the stretched upper band
- Exit Target: 264.43 to 268.27, the resistance zone and 3-month high area
- Stop Loss protection: below 190.97, the key support that marks a deeper trend breakdown
For non-traders, this means Salesforce is still in a healthy uptrend, but it is already running hot and may need to cool off before the next decisive move.
Summary Data CRM
| Last price | 259.23 USD |
| Change 1 day / 5 days / 1 month | -1.97% / 1.26% / 34.50% |
| Trend / MA-cross | uptrend / none |
| SMA20 / SMA50 | 220.92 / 191.65 |
| RSI (14) / Stochastic %K | 76.4 / 88.0 |
| Bollinger %B / ATR | 85% / 11.46 |
| Support / Resistance 20 days | 190.97 / 264.43 |
| Data as of | 4 September 2026 20:30 WIB |
Track CRM stock price daily: live levels, support/resistance and our full CRM analysis history.



