HSBC Stock Gains 0.54% Today, Testing Key Resistance
On September 8, 2026: price 167.60 HKD, trend sideways, RSI 65.9, support 160.30, resistance 167.60. technical analysis of hsbc stock. HSBC Stock Gains — full…

At HK$167.60, HSBC Holdings is pressing against the top of its short-term range after a 0.54% one-day rise, with the latest move taking the stock to the same level as the 20-hour resistance. The price is now above the SMA20 at HK$162.43 and above the SMA50 at HK$159.66, which tells the chart is still leaning upward even though the broader pattern remains sideways. What matters here is not just that HSBC has climbed; it is that the advance has reached a zone where momentum, volume, and volatility are sending mixed signals at the same time.
Trend & Price Action
The structure is constructive but not cleanly directional. HSBC is trading above both the SMA20 and SMA50, which usually means recent prices are stronger than the medium-term average and that the market has recovered from earlier weakness. Yet the trend label is still sideways, and the SMA20 slope of 0.27% over five days suggests only a modest upward tilt rather than a decisive breakout trend. In plain language: the stock is rising, but not in a way that has fully escaped the range. The 20-hour support at HK$160.30 and 20-hour resistance at HK$167.60 frame the current battle, and the price is sitting at the very top of that band, as shown in the chart.
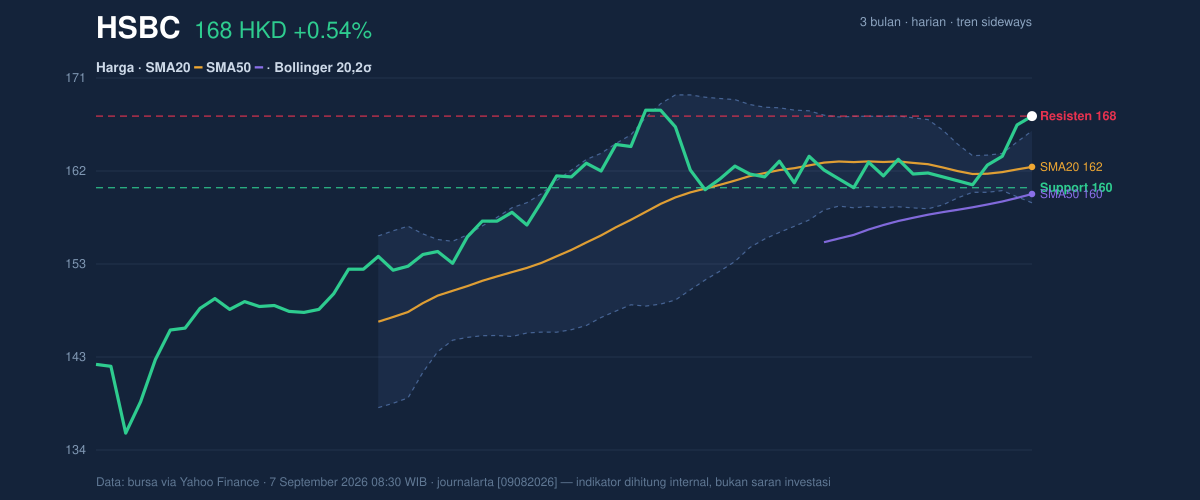
The position inside the range is important. HSBC is already near its 3-month high of HK$169.70, which reduces the amount of overhead room before the stock runs into a prior supply zone where earlier sellers emerged. At the same time, the stock is far above the 3-month low of HK$133.50, so the medium-term recovery is intact. The message from price action is simple: buyers have control for now, but they are testing a ceiling rather than enjoying open air.
Oscillators & Momentum
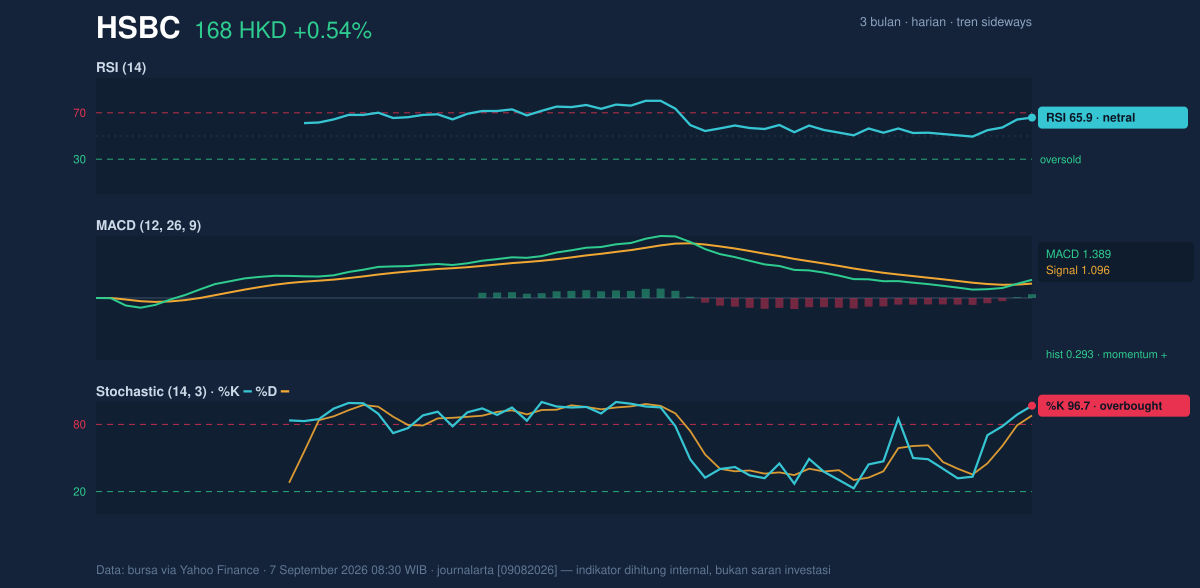
The oscillator picture is more stretched than the trend picture. RSI at 65.9 is still described as neutral, but it sits close enough to the upper end of the scale to show healthy demand without yet flashing a classic overbought warning. The sharper signal comes from stochastic: %K at 96.7 and %D at 87.9 are both in overbought territory, meaning the stock has been closing near the top of its recent range and may need consolidation to cool off. That does not automatically mean reversal; it means the short-term pace has become extended.
MACD at 1.389 above the signal line at 1.096, with a positive histogram of 0.293, shows that upward momentum is still active. MACD is helpful here because it measures whether recent price gains are outrunning the slower trend line. The positive spread says they are. But when MACD strength is paired with an overbought stochastic reading, the setup often signals persistence first and exhaustion later. That is why the chart suggests momentum is still supportive, but not without risk of a pause.
Volatility & Volume
Volatility is unusually restrained for a stock testing resistance. ATR(14) at 2.36, or 1.4% of price, points to low volatility, which often means the market is coiling rather than swinging widely. That fits with the Bollinger Bands: the upper band is HK$166.09, the middle band is HK$162.43, and the lower band is HK$158.76. With %B at 121%, the price is trading beyond the upper band, a sign of strength but also a sign that the move has pushed outside the statistically typical range. The 4.5% band width is also narrowing, which often precedes a breakout or a sharp mean-reversion move. In other words, the market is compressed, and compression rarely lasts long.
Volume supports the move, but only just. Last volume was 17,178,832, about 1.7× the 20-hour average of 10,099,344, and OBV is rising. That combination matters because rising volume on an advance suggests participation is broadening rather than fading. Still, because the stock is already at resistance and over the upper Bollinger band, the volume surge reads more like confirmation of pressure than proof of a fresh trend leg. Strong participation is present; the question is whether it can keep expanding from here.
Key Levels & Scenarios
The immediate map is straightforward. HK$167.60 is both the last price and the current 20-hour resistance, so a clean hold above that level would show that buyers are no longer just probing the top of the range but are trying to convert it into support. Below that, HK$166.09 marks the upper Bollinger band, then HK$162.43 at the SMA20 and Bollinger middle band, and HK$160.30 as the 20-hour support. A slip back under the mid-band would be the first sign that the recent push is losing altitude. A break below HK$160.30 would matter more because it would place price back inside the lower half of the short-term range and weaken the case that the stock is building a breakout.
If the stock can hold above HK$167.60, the chart leaves room to retest the HK$169.70 three-month high. If it fails there, the likely message is not immediate trend reversal, but a return toward the mid-band and SMA20 where the market has recently found balance. The key signal to watch is whether overbought momentum resolves through continuation or through a pause.
Technical Verdict: HOLD (wait & see)
HOLD (wait & see) fits best because the chart is constructive, but the stock is also stretched at resistance with overbought short-term momentum.
- MACD is positive and the histogram remains above zero, which confirms upward momentum is still active.
- Price is above SMA20 and SMA50, showing the stock is trading stronger than its recent averages.
- Stochastic is overbought and %B is 121%, which warns that the move may need to cool before extending further.
Verdict invalidated if price breaks below HK$160.30, because that would weaken the current short-term structure and put the stock back into the lower part of its range.
- Ideal Entry Range: HK$162.43 to HK$160.30
- Exit Target (Target Price): HK$169.70
- Stop Loss Protection: below HK$158.76
For non-traders: HSBC is still trending better than its averages, but it is also close to a ceiling and may need to pause before it can move higher.
The latest 3-month high stands at HK$169.70.
Summary Data HSBC
| Last price | 167.60 HKD |
| Change 1 day / 5 days / 1 month | 0.54% / 4.10% / 3.14% |
| Trend / MA-cross | sideways / none |
| SMA20 / SMA50 | 162.43 / 159.66 |
| RSI (14) / Stochastic %K | 65.9 / 96.7 |
| Bollinger %B / ATR | 121% / 2.36 |
| Support / Resistance 20 days | 160.30 / 167.60 |
| Data as of | 7 September 2026 08:30 WIB |


