ORCL Stock Analysis: Gains 3.08%, Testing Key Resistance
On September 8, 2026: price 158.78 USD, trend uptrend, RSI 60.4, support 141.32, resistance 158.78. technical analysis of orcl stock. ORCL Stock Analysis —…

Oracle is trading at a fresh short-term high, but the move has pushed the stock into a technically stretched zone where momentum and volatility are no longer giving the same clean signal. The shares closed at 158.78 USD, up 3.08% on the day, extending a 5.26% gain over five days and an 8.00% rise over one month, according to Yahoo Finance data cited in the prompt. For international readers, the key point is simple: the stock is still in an uptrend, but it is now testing the limits of that move.
Trend & Price Action
The broader structure remains constructive. Oracle is trading above the 20-day SMA at 148.31 and well above the 50-day SMA at 139.84, which tells traders the recent price advance is being supported by intermediate-term trend strength rather than a one-day spike. The uptrend is also being reinforced by the 0.90%/5-day slope in the SMA20, a sign that the short-term average itself is still rising. In plain language, the trend line is not flattening out yet.
But the price is now pressing the upper edge of its recent envelope. As shown in the chart, Oracle’s last price sits at 158.78 USD, just above the Bollinger upper band at 157.99, with %B at 104%. %B above 100 means price has moved beyond the upper band, which often signals strength, but also warns that the move may be extended rather than comfortably sustainable. The stock is also at the 100% level of its 20-hour range, with support at 141.32 and resistance now marked at 158.78. That positioning matters: when a stock is pinned to the top of its near-term range, the market is saying it has already used up a lot of the easy upside for the moment.
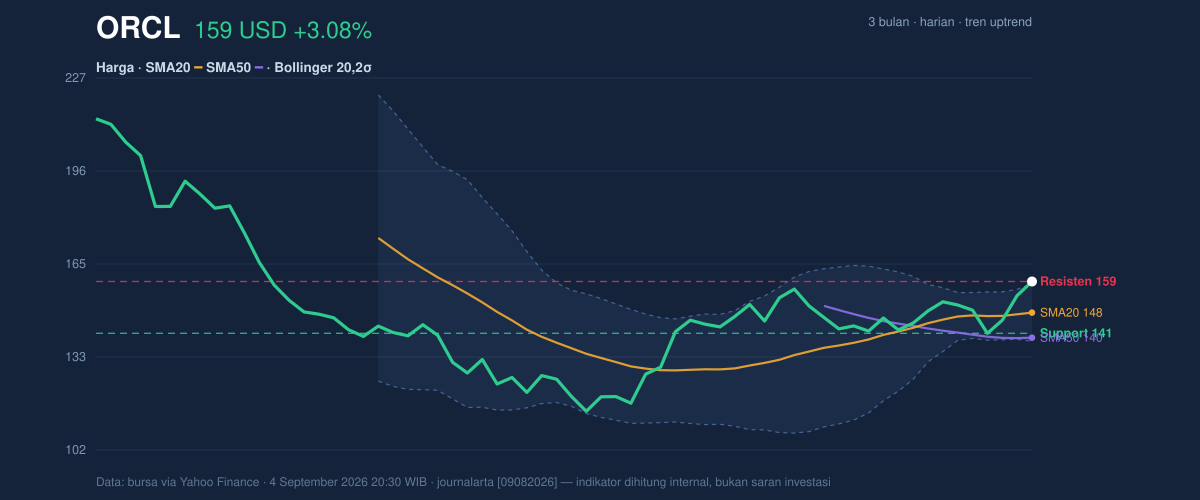
A short burst of strength, then a long shadow of caution.
Oscillators & Momentum
The momentum tools are split, and that split is the most important part of the story. The RSI at 60.4 is still neutral, which means the stock is not yet in classic overbought territory on that measure. RSI is the “speedometer” of price strength; at this level, it says Oracle has room to remain firm, but not enough to claim the move is deeply overextended. By contrast, the Stochastic oscillator is overbought, with %K at 95.9 and %D at 75.2. Stochastic is more sensitive to short-term swings, so this reading suggests the latest push has moved faster than the trend’s average pace. That often happens near local peaks or during breakout attempts.
The MACD is positive, with 2.423 above the signal line at 1.459 and a 0.964 histogram. That combination means upward momentum is still present and has not yet rolled over. In practical terms, the trend is still being confirmed by momentum, even though one oscillator is flashing overheating. The chart shows that tension clearly: strong trend confirmation from MACD, but a short-term stretch in Stochastic.
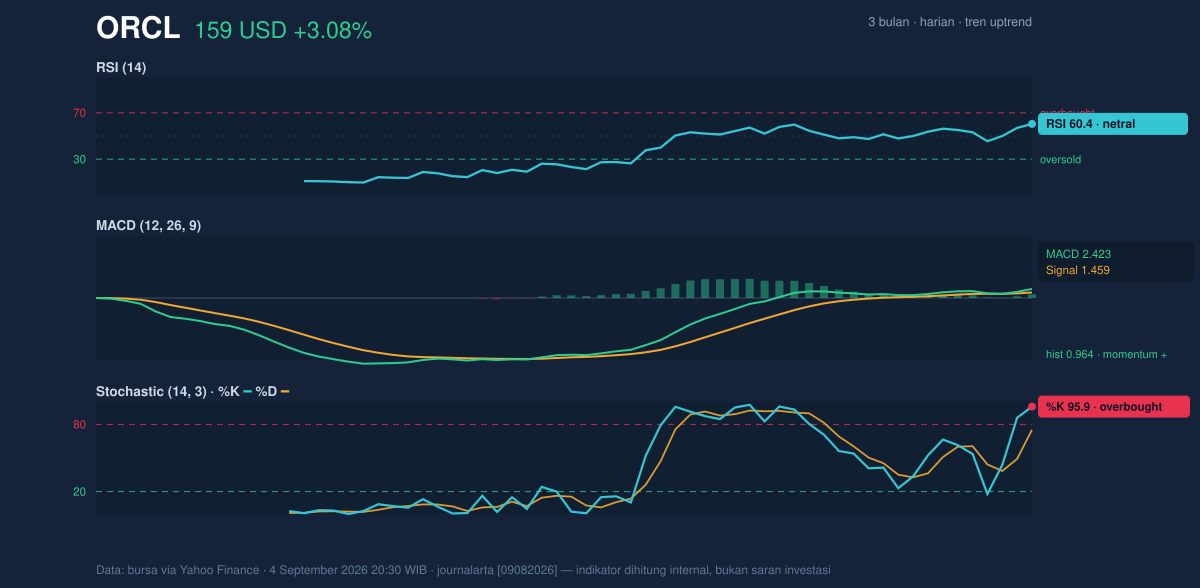
Momentum is firm, but it is no longer unambiguous.
Volatility & Volume
Volatility is elevated enough to matter. The ATR at 6.22, or 3.9% of price, says Oracle can move meaningfully in either direction over a short period. ATR measures the average daily range, so a reading like this tells readers not to expect a quiet tape. The Bollinger band width of 13.1% is described as normal, which means the market is not in a squeeze that would typically precede a sharp expansion. Instead, price has already moved to the edge of the band system, and that usually shifts the question from “will it move?” to “can it hold this pace?”
Volume adds some credibility to the move. Last trade volume was 26,430,100, above the 20-hour average of 22,719,525, or about 1.2× normal. That suggests the rally is not happening on thin participation. The OBV is rising, which means cumulative volume flow is still favoring buyers. In market terms, rising OBV with rising price is a healthy sign: it implies the advance is being backed by actual participation, not just a low-volume drift.
Still, participation does not erase extension. It only says the move has support.
Key Levels & Scenarios
The nearest technical floor is the 20-hour support at 141.32, while the immediate ceiling is now the 158.78 resistance area because price has already reached it. Below that, the 20-day SMA at 148.31 is the first trend reference; if price slips back under it, the stock would still be above the 50-day SMA at 139.84, but the short-term trend would look less forceful. The Bollinger midline at 148.31 is especially important because it doubles as the 20-day average; losing it would mean the stock is no longer trading with the same short-term momentum advantage.
The 3-month range gives broader context: Oracle has traveled between 231.44 and 114.50. That wide span says the stock has already lived through a much larger cycle, so today’s move is only one chapter in a broader, more volatile story.
If price holds above 158.78, the market is signaling continuation strength. If it slips back below the upper Bollinger band at 157.99 and then the 20-day SMA at 148.31, the current breakout-like behavior starts to look more like an overextended advance.
Technical Verdict: HOLD (wait & see)
Oracle’s chart is strong, but it is also stretched. The trend is still up, MACD remains positive, and OBV is rising, which argues that buyers are still in control. Yet Stochastic is overbought, price is already above the upper Bollinger band, and the stock is sitting at the top of its near-term range. That mix usually calls for patience rather than urgency.
- Ideal Entry Range: 148.31 to 141.32 — the 20-day SMA and nearby support zone, where the trend would be less extended.
- Exit Target: 158.78 — the current resistance/price area; a sustained move above it would need fresh confirmation.
- Stop Loss protection: 139.84 — the 50-day SMA, which would signal the intermediate trend is weakening if broken.
- Verdict invalidated if price breaks below 139.84.
For non-traders: Oracle still looks strong, but after a fast run, the chart says the stock is more likely to pause or pull back than to sprint in a straight line.
“The next move matters more than the last one.”
Summary Data ORCL
| Last price | 158.78 USD |
| Change 1 day / 5 days / 1 month | 3.08% / 5.26% / 8.00% |
| Trend / MA-cross | uptrend / none |
| SMA20 / SMA50 | 148.31 / 139.84 |
| RSI (14) / Stochastic %K | 60.4 / 95.9 |
| Bollinger %B / ATR | 104% / 6.22 |
| Support / Resistance 20 days | 141.32 / 158.78 |
| Data as of | 4 September 2026 20:30 WIB |


