Alibaba Stock Technicals Today: Drops 0.09%, Momentum Weakens
On September 9, 2026: price 109.50 HKD, trend sideways, RSI 40.3, support 107.50, resistance 126.70. technical analysis of alibaba stock.
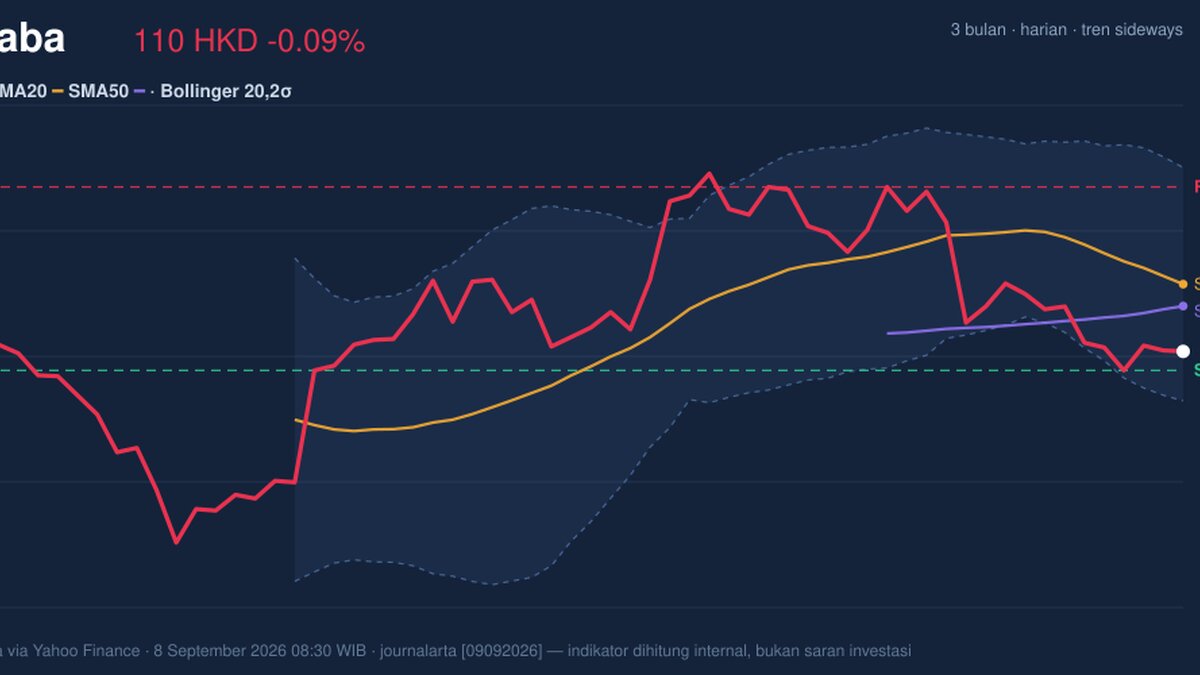
Alibaba Group’s Hong Kong-listed shares slipped to HKD 109.50 on HKEX in morning trade, extending a one-month slide that has pushed the stock well below its short-term trend lines and back toward the lower end of its recent range. The move matters less for the tiny daily decline than for what it says about positioning: sellers have been in control for weeks, and the chart is now showing a stock that is technically weak but also increasingly stretched on the downside, as shown in the chart.
Trend & Price Action
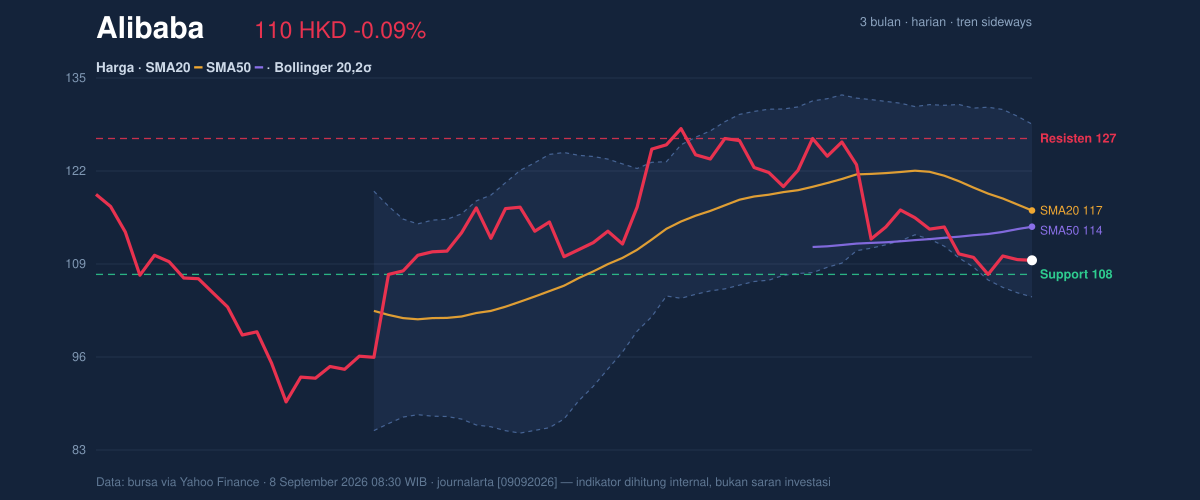
The price sits below SMA20 at 116.53 and below SMA50 at 114.24, which tells traders the stock is trading under both its short- and medium-term averages. That is a classic sign that recent momentum has not been strong enough to reclaim lost ground. The 20-day moving average is also sloping down at -3.43% over 5 days, a useful signal that the trend is not merely sideways noise but a controlled drift lower. In plain language, when the average itself is falling, it means recent closes have been getting worse, not just bouncing around.
There is no fresh MA crossover, so the chart does not yet show a new trend reversal signal. Instead, the stock is hovering near the lower portion of its 3-month band, with the current price well below the 3-month high of 130.30 and above the 3-month low of 88.65. The immediate 20-hour support at 107.50 is close enough that any further weakness could test whether buyers are willing to defend the area. The stock is currently sitting in the lower part of its 20-hour range, around 10% of that range, which usually means the market is still pricing caution rather than conviction.
A weak chart, but not a broken one.
Oscillators & Momentum
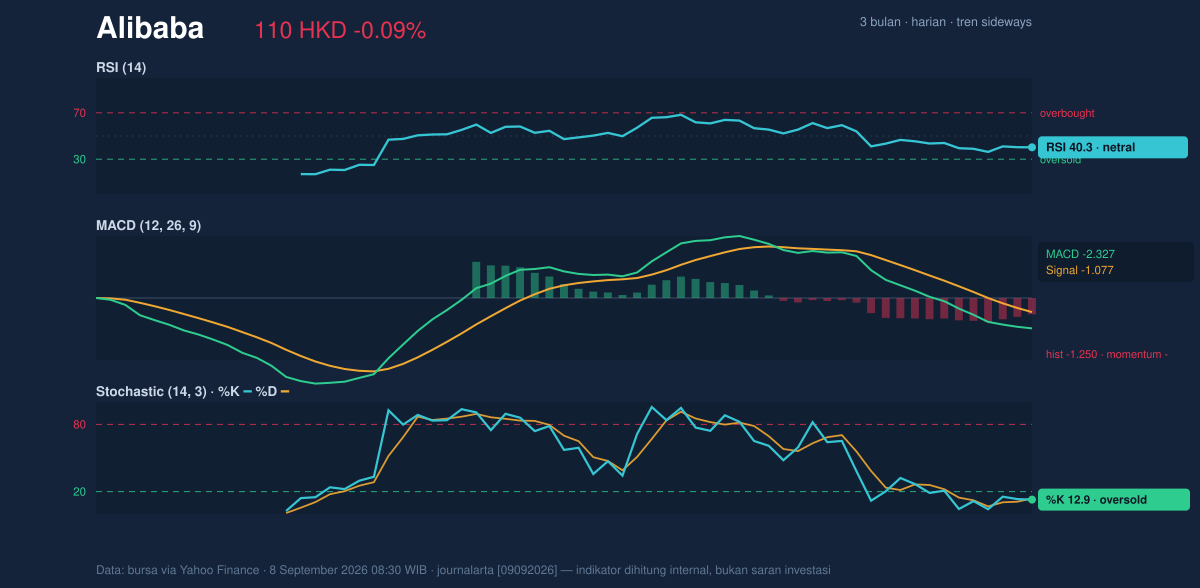
Momentum indicators are mixed in a way that often appears near turning points, but not all at once. RSI at 40.3 is neutral, which means the stock is not technically oversold yet, even after the recent decline. That matters because a neutral RSI after a sharp drop suggests the selloff has been meaningful, but not necessarily exhausted.
The more interesting signal comes from Stochastic %K at 12.9 and %D at 13.9, both in oversold territory. Stochastic is a faster indicator than RSI, so it often flags short-term pressure earlier. When both lines are that low, it usually means the stock has been under persistent selling and may be vulnerable to a bounce if sellers pause. But oversold does not mean reversal on its own; it simply means the downside may be getting crowded.
The trend confirmation still leans negative because MACD at -2.327, with the signal line at -1.077 and a histogram of -1.250, shows downside momentum remains intact. For readers less familiar with the term, MACD compares shorter- and longer-term trend speed; when it is below the signal line and the histogram is negative, it usually means the recent trend is still weakening faster than it is stabilizing. So while Stochastic hints at short-term exhaustion, MACD says the broader momentum has not yet turned.
Volatility & Volume
The Bollinger band structure adds another layer of caution. The stock is trading near the lower band, with the lower Bollinger band at 104.33, the middle band at 116.53, and the upper band at 128.73. The %B reading of 21% means price is sitting close to the lower edge of the band structure, which often reflects downside pressure or an oversold condition. At the same time, the band width of 20.9% shows volatility is expanding rather than compressing. That is important: a wider band means the market is not calm, and moves can extend further than traders expect.
The ATR(14) of 4.42, or 4.0% of price, reinforces that point. ATR measures average daily movement, so a 4.0% reading indicates the stock can travel quickly in either direction. This is where price can look stable for a few sessions and then move sharply without much warning.
Volume is not confirming a rebound yet. The latest turnover of 44,150,465 is only about 0.5× the 20-hour average of 97,659,544, and OBV is falling. OBV, or on-balance volume, tracks whether trading activity is accumulating or distributing shares over time. A falling OBV alongside a weak price usually means rallies are not being backed by broad participation. In other words, the market is still selling into strength rather than building a base.
Key Levels & Scenarios
The first level to watch is support at 107.50. A clean hold above that area would suggest the stock is still trying to build a floor near the lower end of its recent range. Below that, the chart would start to lean more decisively toward the lower Bollinger band at 104.33, which is the next technical marker where buyers may attempt to re-enter.
On the upside, the nearest resistance is 126.70. That level matters because it sits well above the current price and close to the upper half of the recent trading band. A move back toward it would require not just a bounce, but a change in momentum and volume behavior. The SMA20 at 116.53 is also an important intermediate hurdle; reclaiming it would be the first sign that the short-term downtrend is easing.
Technical Verdict: HOLD (wait & see)
HOLD (wait & see) is the clearest reading from the current setup.
- MACD remains negative, so the broader momentum is still leaning lower.
- Price is below SMA20 and SMA50, confirming the stock has not yet recovered its short-term trend.
- Stochastic is oversold and price is near lower-band territory, which raises bounce potential but does not confirm reversal.
Verdict invalidated if price falls below 107.50, because that would expose the lower Bollinger band at 104.33 and weaken the current range floor.
- Ideal Entry Range: 107.50 to 104.33
- Exit Target: 116.53, then 126.70
- Stop Loss protection: below 104.33
In plain English: the chart says Alibaba is weak, but it is also close to a zone where the selling could start to lose force.
Summary Data Alibaba
| Last price | 109.50 HKD |
| Change 1 day / 5 days / 1 month | -0.09% / -0.82% / -13.37% |
| Trend / MA-cross | sideways / none |
| SMA20 / SMA50 | 116.53 / 114.24 |
| RSI (14) / Stochastic %K | 40.3 / 12.9 |
| Bollinger %B / ATR | 21% / 4.42 |
| Support / Resistance 20 days | 107.50 / 126.70 |
| Data as of | 8 September 2026 08:30 WIB |
Track Alibaba share price daily: live levels, support/resistance and our full Alibaba analysis history.



