AstraZeneca Momentum Gains: Stock Drops 1.08% (September 9, 2026)
On September 9, 2026: price 11,876.00 GBp, trend sideways, RSI 46.8, support 11,460.00, resistance 12,476.00. technical analysis of astrazeneca stock.
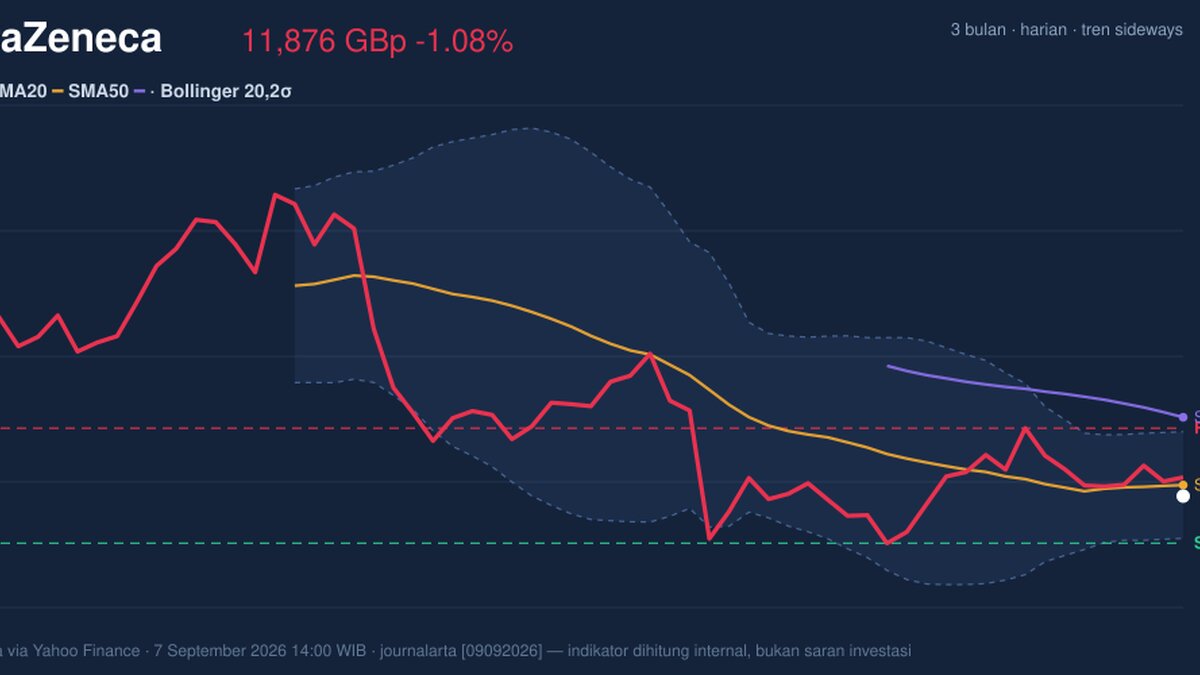
AstraZeneca’s London-listed shares were last quoted at 11,876.00 GBp, down 1.08% on the day and sitting below the short-term average, according to data from the London Stock Exchange via Yahoo Finance. That placement matters more than the size of the daily move. It means the stock is still trading in a sideways phase, but with the burden of proving that recent weakness is only a pause rather than the start of a deeper retracement.
Trend & Price Action
The headline signal is straightforward: price is below the SMA20 at 11,974.20 and well under the SMA50 at 12,573.04. In plain English, the market is trading beneath both its near-term and medium-term trend markers, which usually tells technicians that sellers still have the upper hand, even if the broader pattern is not yet a full breakdown. The absence of a fresh MA-cross also matters. It suggests there has not been a decisive shift in the moving-average structure, so the stock is not flashing a clean trend reversal either way.
That is why the chart, as shown in the
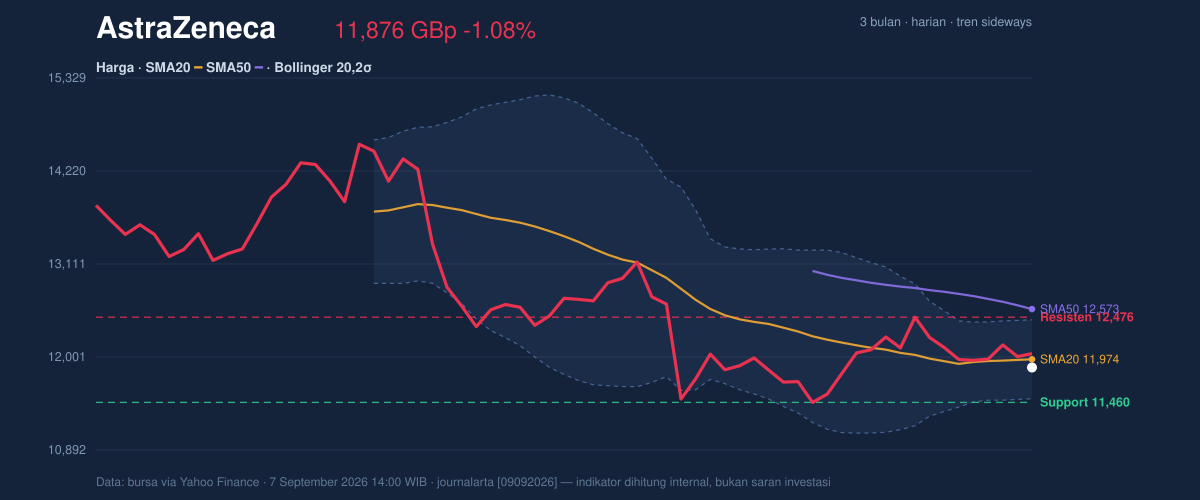
section, reads as a compressed range rather than a directional breakout. The shares are in the lower half of the recent band, at about 41% of the 20-hour range, with 11,460.00 acting as the nearest support and 12,476.00 as the nearest resistance. Price sitting below the middle Bollinger line, which is the same as the SMA20, reinforces the idea that the stock has not yet regained short-term control. It is not collapsing, but it is also not showing enough strength to reclaim the trend.
The broader context remains important. Over the past three months, AstraZeneca has traded between 15,126.00 and 9,892.00, so the current level is still closer to the lower half of that wider band than to the highs. That positioning tells investors the market has already repriced some optimism, but not enough to suggest a fresh expansion in value is underway.
Oscillators & Momentum
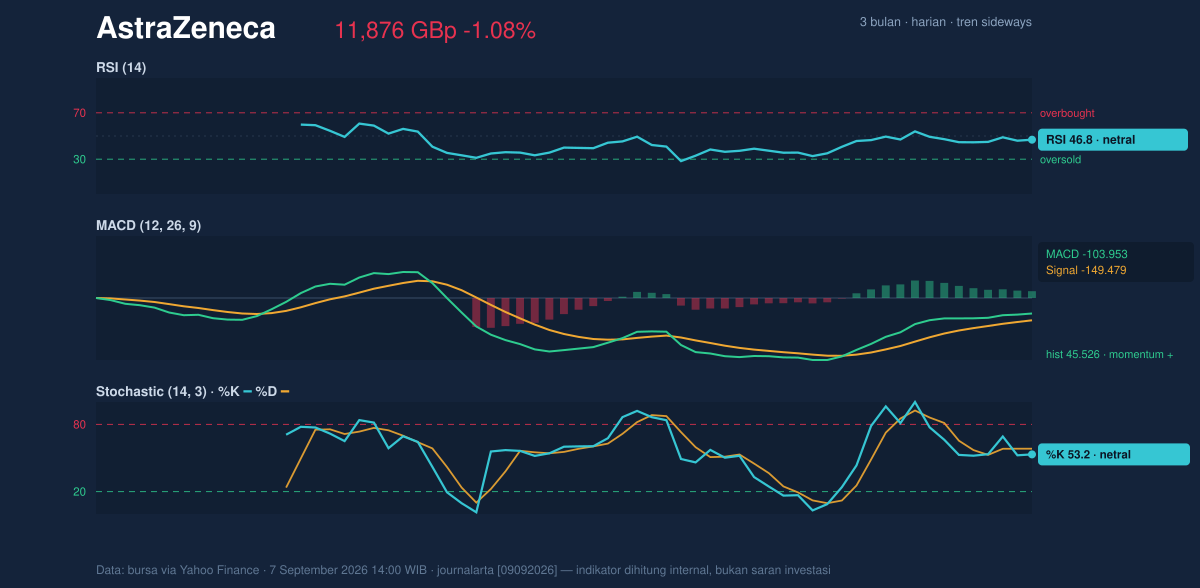
Momentum is mixed, and that is the key nuance. The RSI at 46.8 is neutral, which means the stock is neither stretched on the upside nor washed out on the downside. The Stochastic %K at 53.2 and %D at 58.3 also sit in the middle ground. In practical terms, that says the recent move lower has not yet become oversold, so there is no strong technical case that a reflex bounce is imminent just because price has weakened.
The one constructive element is the MACD at -103.953 with a signal line at -149.479 and a positive histogram of 45.526. For general readers, MACD compares short- and medium-term momentum; when the histogram turns positive, it means downward pressure is easing and the faster line is moving above the slower benchmark. That does not equal a bullish trend by itself, but it does indicate that the selling impulse is losing force. In other words, the chart is not confirming a strong downtrend, even though price remains below the averages.
This combination is why the momentum picture is best described as stabilising rather than decisive. The oscillators are not overbought, which limits immediate downside exhaustion signals, but the MACD is better than the price action, which often happens when a market is trying to base before it can recover.
Volatility & Volume
Volatility is contained, but not dormant. The Bollinger band width of 7.9% is narrowing, which signals a squeeze. That matters because squeezes often precede a larger move once price escapes the band structure. The current %B at 40% says price is below the midpoint of the envelope, leaning weak but not extreme. It is a subtle message: the stock is not under severe stress, yet it has not built enough upward pressure to challenge the upper band at 12,445.02.
The ATR at 297.03, or about 2.5% of the share price, points to moderate day-to-day movement. So while the range is tight relative to recent history, the stock can still travel enough in a single session to test either boundary if a catalyst appears.
Volume is less supportive. The latest turnover of 1,976,565 is only 0.7x the 20-session average of 2,837,993, and OBV is down. OBV, or on-balance volume, tracks whether trading activity is broadly accumulating or distributing shares. A falling OBV alongside subdued volume suggests the latest weakness has not been met with strong buying interest. That does not guarantee further decline, but it does mean any rebound would likely need stronger participation to stick.
Key Levels & Scenarios
The market is now boxed in by clearly defined levels. A sustained move above 12,476.00 would put the stock back at the top of its short-term range and closer to the SMA20 at 11,974.20 plus the upper Bollinger structure, while a failure to hold 11,460.00 would expose the lower band at 11,503.38 and raise the risk of a deeper test toward the recent floor. The key point is that the current setup is less about trend certainty and more about whether the squeeze resolves upward or downward.
Technical Verdict: HOLD (wait & see)
HOLD (wait & see)
- Price is below the SMA20 and SMA50, so the stock has not yet reclaimed its short- or medium-term trend.
- MACD histogram is positive, which shows momentum is improving even though price is still weak.
- Bollinger bands are squeezing, signalling a potential breakout, but direction is not confirmed.
- Verdict invalidated if price falls below 11,460.00, because that would break near-term support and weaken the range structure.
- Ideal entry range: 11,460.00 to 11,974.20
- Exit target: 12,445.02 to 12,476.00
- Stop loss protection: below 11,460.00
For non-traders, this means AstraZeneca’s chart is not weak enough to call broken, but not strong enough yet to show a clean recovery.
The latest 3-month low is 9,892.00.
Summary Data AstraZeneca
| Last price | 11,876.00 GBp |
| Change 1 day / 5 days / 1 month | -1.08% / -0.79% / -0.17% |
| Trend / MA-cross | sideways / none |
| SMA20 / SMA50 | 11,974.20 / 12,573.04 |
| RSI (14) / Stochastic %K | 46.8 / 53.2 |
| Bollinger %B / ATR | 40% / 297.03 |
| Support / Resistance 20 days | 11,460.00 / 12,476.00 |
| Data as of | 7 September 2026 14:00 WIB |
Track AstraZeneca share price daily: live levels, support/resistance and our full AstraZeneca analysis history.



