HSBC Momentum Gains: Stock Drops 1.61% (September 9, 2026)
On September 9, 2026: price 164.90 HKD, trend uptrend, RSI 57.2, support 160.30, resistance 167.60. technical analysis of hsbc stock. HSBC Momentum Gains —…
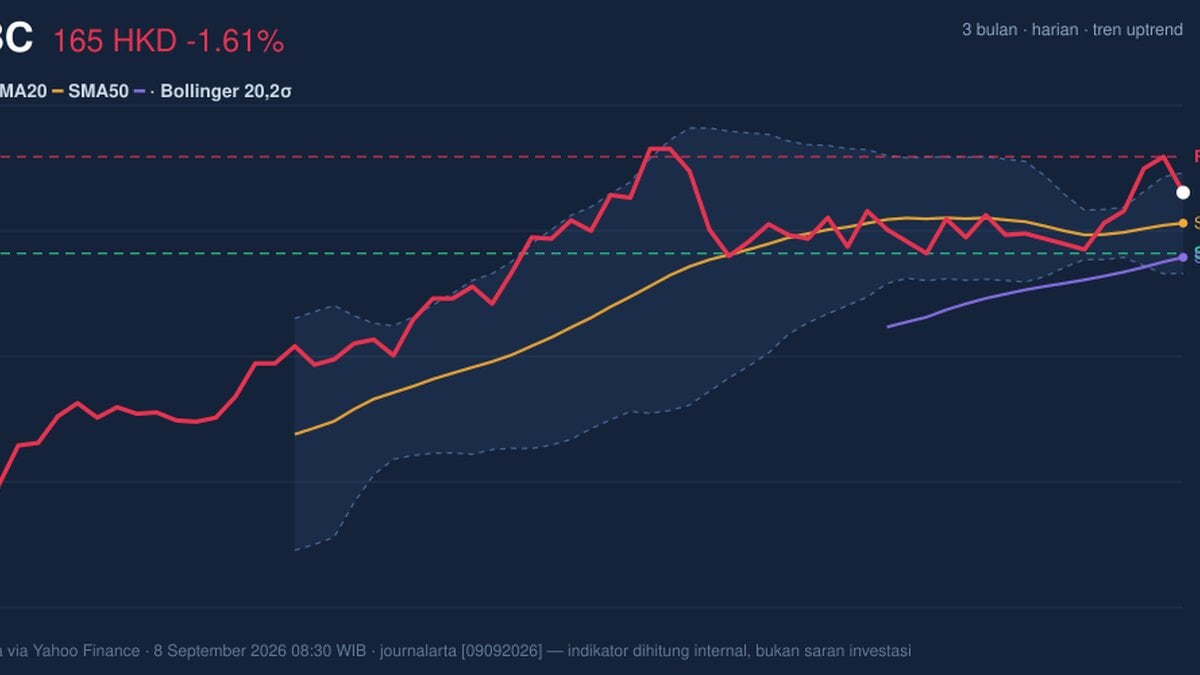
HSBC Holdings (0005.HK) closed at HKD 164.90, down 1.61% from the previous close of HKD 167.60, but the broader pattern still points to an uptrend as shown by the rising SMA20 and the price holding above both short- and medium-term averages. The key question now is not whether the share has momentum — it does — but whether that momentum can push through the nearby ceiling at HKD 167.60 and escape the narrowing Bollinger band that often precedes a larger move.
Trend & Price Action
The structure remains constructive. HSBC is trading above its SMA20 at HKD 162.58 and well above its SMA50 at HKD 160.00, which tells us the stock is still sitting on top of its intermediate trend rather than fighting it. The SMA20 is rising at 0.55% over 5 days, a useful signal because a rising moving average usually reflects sustained buying interest rather than a one-day bounce. There is no fresh MA-cross, so the chart is not flashing a new trend-change signal; instead, it is extending an existing one.
The stock is also trading in the upper part of its recent range, at 63% of the 20-hour band between HKD 160.30 support and HKD 167.60 resistance. That positioning matters: it suggests buyers have managed to keep price away from the lower end of the range, but they have not yet forced a clean break above resistance. The 3-month high of HKD 169.70 sits just above that ceiling, so the market is close to a zone where momentum traders may test whether the share can reclaim its recent peak.
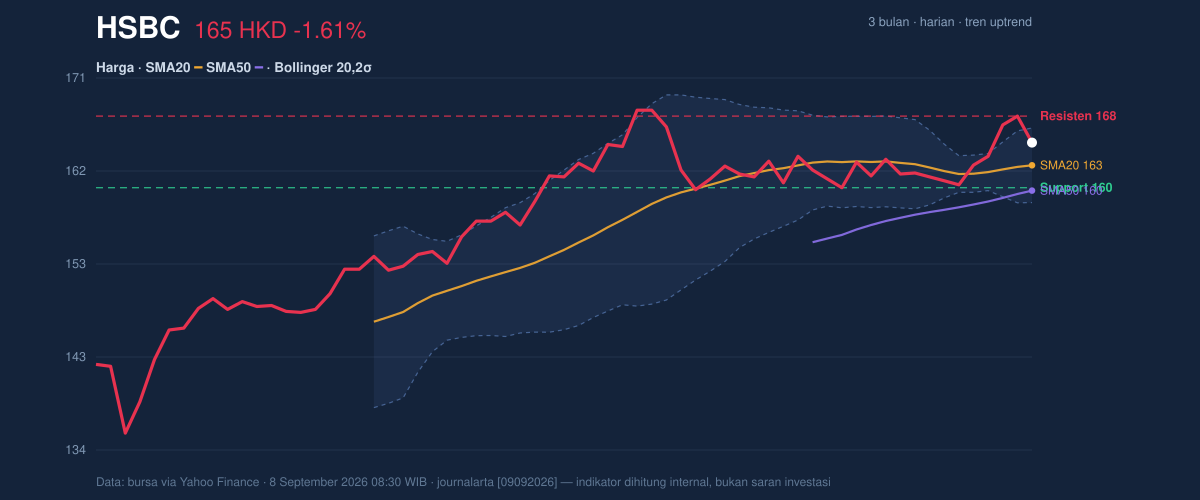
One short-term caution: the stock slipped 1.61% on the day even though it is still up 2.68% over 5 days and 1.98% over 1 month. That combination often means the trend is intact, but the latest session was not strong enough to extend the move. In plain English, the tape is still healthy — just not yet decisive.
Oscillators & Momentum
The momentum picture is mixed rather than euphoric. RSI at 57.2 is neutral, which means the stock is neither overbought nor oversold. That is important because it leaves room for further upside without immediately running into a stretched condition. The Stochastic %K at 67.0 and %D at 84.2 also sit in neutral territory, but the gap between the two lines suggests short-term momentum has cooled from a stronger reading. When Stochastic is below its signal line, it often hints that the latest push is losing some speed, even if the broader trend has not broken.
The more supportive signal comes from MACD at 1.399 above its signal line at 1.156, with a positive histogram of 0.243. MACD measures whether recent price action is accelerating relative to the longer trend; a positive histogram means the short-term trend is still outperforming the baseline. So while RSI and Stochastic are not screaming for attention, MACD says the underlying trend remains tilted upward.
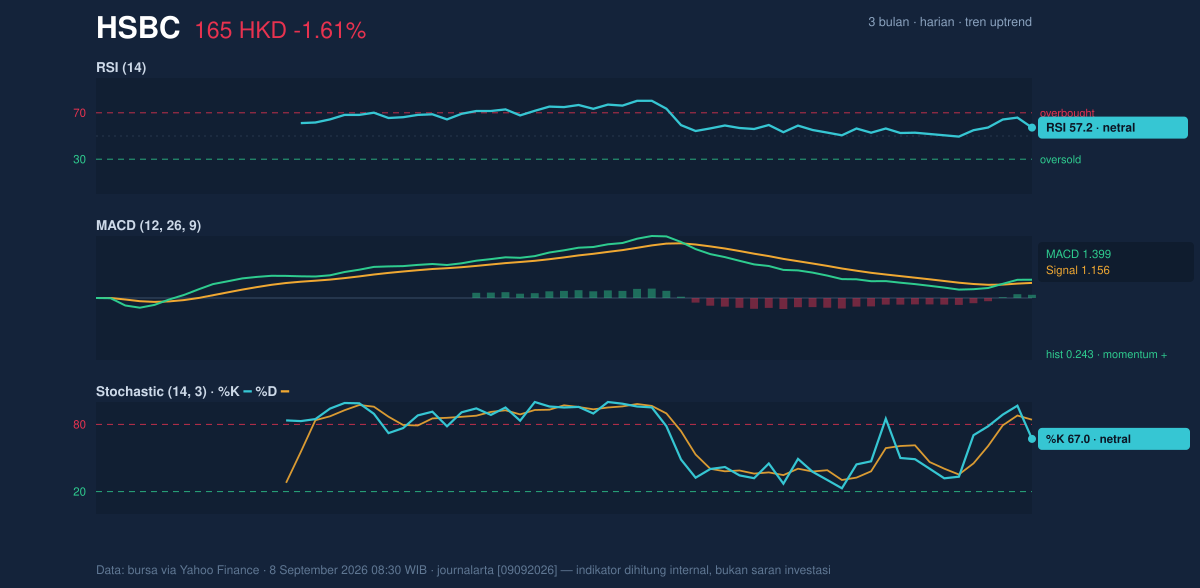
That blend — neutral oscillators, positive MACD — usually describes a market that is still trending, but not yet in a breakout sprint. It is a setup that can continue if price pressure builds, but it can also stall if buyers fail to show up at resistance.
Volatility & Volume
The Bollinger Bands are telling an especially interesting story. Price is sitting near the upper half of the band structure, with %B at 80%, meaning HSBC is trading close to the upper band at HKD 166.38. That is not a direct sell signal; it simply shows the share is leaning toward the top of its recent volatility envelope. More importantly, the band width is only 4.7% and is narrowing. A squeeze like this often signals compressed trading conditions, where the next meaningful move can be sharper than recent day-to-day action. In other words, the market is coiling.
Volatility is also subdued. ATR(14) at 2.39, equal to 1.4% of price, indicates relatively low day-to-day movement. Low ATR can help a trend persist smoothly, but it also means the market may need a catalyst — such as stronger volume — to break out of the current range. That catalyst is not obvious yet. Last volume was 7,225,458, below the 20-day average of 9,972,805, or about 0.7x normal. Lower-than-average volume on a day when the stock failed to extend higher suggests conviction was limited.
Still, one important counterweight is that OBV is rising. On-balance volume tracks whether volume is generally flowing into or out of the stock, and a rising OBV implies accumulation is continuing underneath the surface even if the latest session was quieter. That divergence — softer daily volume, firmer OBV — often means larger investors are not abandoning the trend.
Key Levels & Scenarios
The immediate map is clear. HKD 167.60 is the first resistance to watch, and a move through that level would place the stock back into direct contact with the 3-month high of HKD 169.70. On the downside, HKD 162.58 — the SMA20 and Bollinger middle band — is the first meaningful support, followed by HKD 160.30. If price loses that area, the chart would begin to look less like a controlled uptrend and more like a range failure. The lower Bollinger band at HKD 158.79 marks the next technical floor on the current setup.
HSBC is still trending higher, but the move now depends on whether the stock can convert a tight, low-volume consolidation into a clean break above resistance. The chart shows a market with supportive trend structure, positive MACD, and rising OBV, yet with neutral oscillators and a narrow band that suggests the next move could be abrupt rather than gradual.
Technical Verdict: HOLD (wait & see)
- Reason 1: Price remains above the SMA20 at HKD 162.58 and SMA50 at HKD 160.00, keeping the uptrend intact.
- Reason 2: MACD is positive and the histogram is above zero, which supports ongoing trend momentum.
- Reason 3: Bollinger Bands are squeezing and volume is only 0.7x normal, so the chart needs confirmation before a directional break is trusted.
Verdict invalidated if price falls below HKD 160.30, because that would break the nearest support and weaken the current trend structure.
- Ideal Entry Range: HKD 162.58 to HKD 164.90
- Exit Target (Target Price): HKD 167.60, then HKD 169.70
- Stop Loss Protection: below HKD 160.30, with the Bollinger lower band at HKD 158.79 as the deeper technical line
For non-traders: the stock is still behaving like an uptrend, but it has not yet proved it can break out of its current range.
The latest 3-month high stands at HKD 169.70.
Summary Data HSBC
| Last price | 164.90 HKD |
| Change 1 day / 5 days / 1 month | -1.61% / 2.68% / 1.98% |
| Trend / MA-cross | uptrend / none |
| SMA20 / SMA50 | 162.58 / 160.00 |
| RSI (14) / Stochastic %K | 57.2 / 67.0 |
| Bollinger %B / ATR | 80% / 2.39 |
| Support / Resistance 20 days | 160.30 / 167.60 |
| Data as of | 8 September 2026 08:30 WIB |
Track HSBC share price daily: live levels, support/resistance and our full HSBC analysis history.



