HSBC Testing Key Resistance: Stock Drops 0.34% (September 9, 2026)
On September 9, 2026: price 1,574.80 GBp, trend sideways, RSI 64.4, support 1,497.20, resistance 1,580.20. technical analysis of hsbc stock.
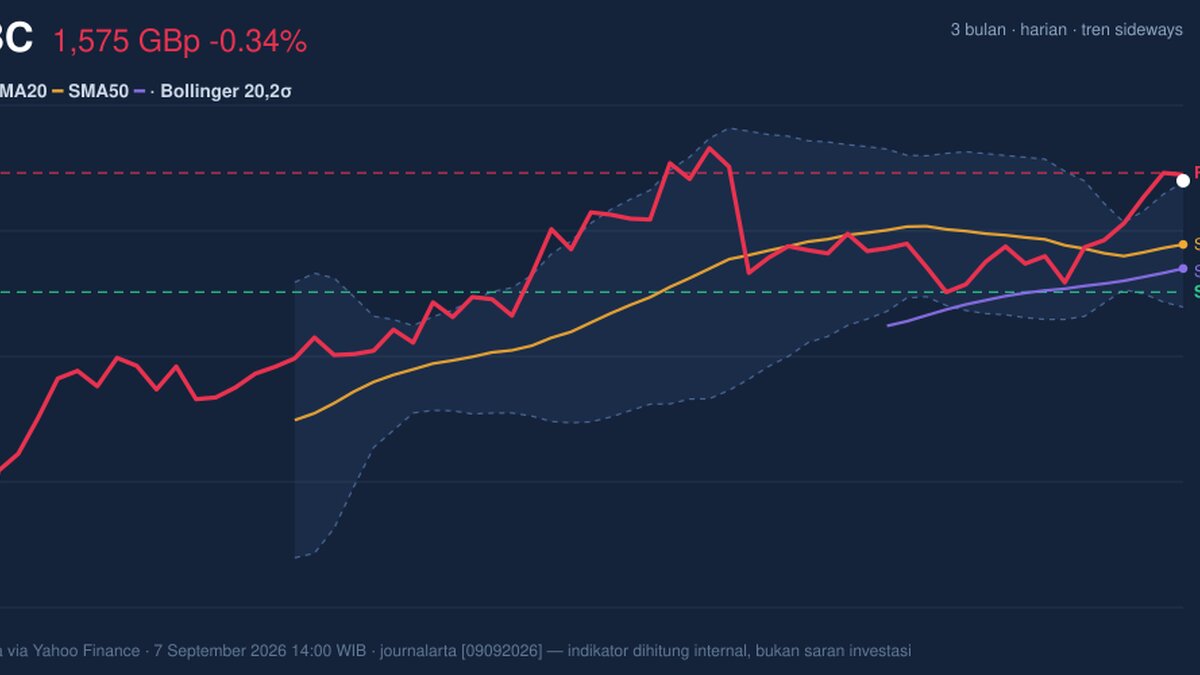
HSBC Holdings’ London-listed shares were last at 1,574.80 GBp at 7 September 2026 14:00 WIB, slipping 0.34% on the day but still holding a 3.04% gain over five days and 2.98% over one month. That places the stock near the top of its recent range, with price action sitting just under the latest 1,580.20 resistance and close to the 1,610.00 three-month high. The message from the chart is not of a sharp trend, but of a market that has been grinding higher inside a sideways structure — and now looks compressed enough to force a decision.
Trend & Price Action
HSBC remains in a sideways trend, but that label can hide an important detail: the SMA20 at 1,530.39 is above the SMA50 at 1,513.63, so the short-term average still sits above the medium-term one. That is not a fresh golden cross, because there has been no new MA-cross, but it does show the recent price structure is still leaning upward rather than deteriorating. The share price is also trading above the SMA20, which means buyers have managed to keep the stock above the level that often acts as a short-term balance point between demand and supply.
What matters most here is where the stock sits inside its own range. At 93% of the 20-day range, HSBC is trading close to the ceiling rather than the floor, which usually tells you the market is testing sellers more than buyers. That positioning matters because the last quoted resistance, 1,580.20, is only a small step above the current price. If the stock cannot clear that area, the recent bounce risks stalling into a familiar range trade. If it does, the move would be happening from an already elevated base.
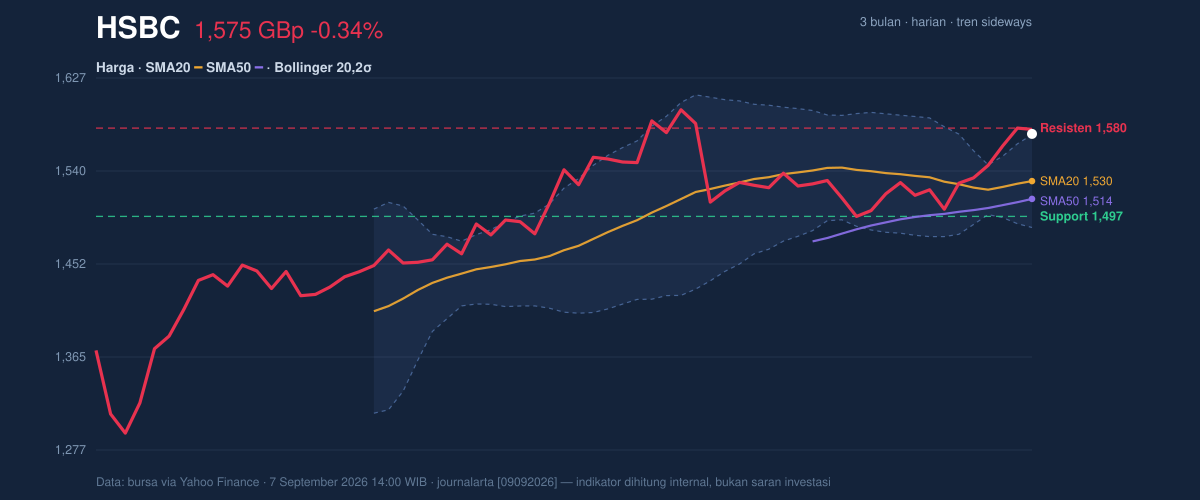
The chart is showing a market that is compressed, not exhausted.
Oscillators & Momentum
The momentum picture is mixed, and that mix is exactly what makes the current setup interesting. RSI at 64.4 is still classed as neutral, so the stock is not yet in a classic overbought warning zone on this measure. But the Stochastic %K at 93.3 and %D at 95.0 are clearly overbought, which means the latest push has moved fast enough that the short-term pace may be running ahead of itself. In plain terms, RSI says the trend has room to extend, while Stochastic says the stock is already stretched near the top of its recent swing.
The strongest momentum signal comes from MACD: the line at 13.255 sits above the signal line at 8.105, with a positive histogram of 5.150. That combination means upside momentum still exceeds the recent average pace, and the gap between the MACD line and signal line suggests the move has not yet fully faded. So even though the fast oscillator is overheated, the broader momentum engine remains constructive.
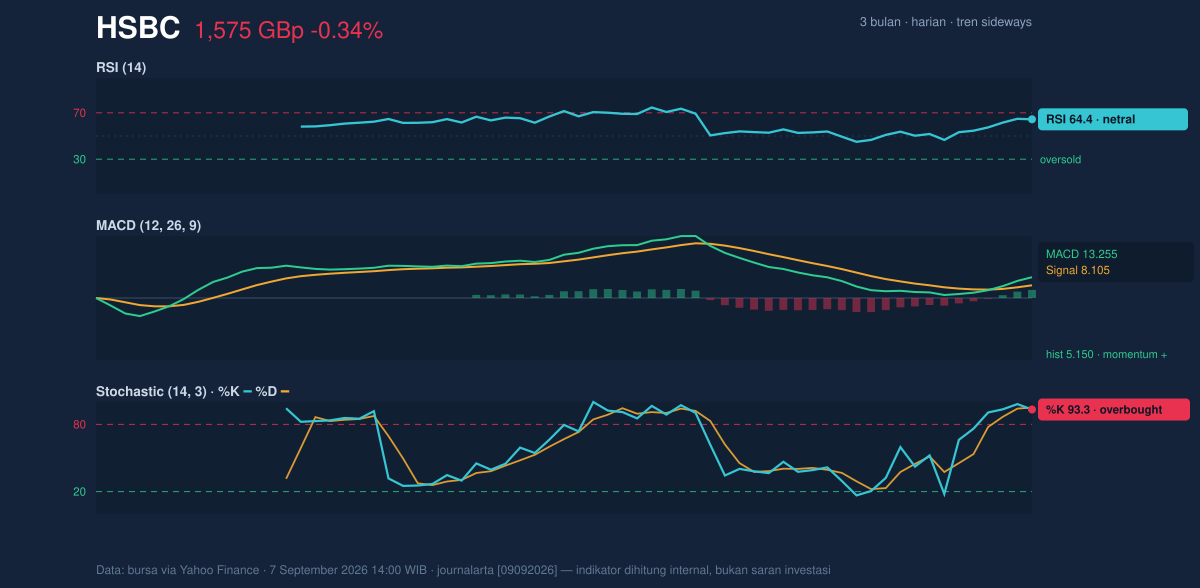
That is the classic tension: overbought short-term readings alongside positive MACD momentum.
Volatility & Volume
Bollinger Bands add another layer to the setup. The upper band is 1,574.04, the middle band is 1,530.39, and the lower band is 1,486.74. With price at %B 101%, HSBC is trading just beyond the upper band, which often signals an extended move rather than a comfortable equilibrium. That does not automatically mean reversal; it often means the market is pressing into breakout territory. The key detail is that the band width is only 5.7% and is described as a squeeze, which points to compressed volatility. Squeezes matter because they usually precede a larger move once price escapes the range.
Volatility is not especially wild yet. The ATR(14) at 25.60, equal to 1.6% of price, suggests movement is present but not disorderly. Volume, however, tempers the enthusiasm. The latest turnover of 13,852,877 is only 0.7× the 20-day average of 19,623,538, so the latest advance is not being backed by heavy participation. That can mean the move is being driven by fewer hands than usual, which makes breakouts less convincing until volume returns. Still, OBV is rising, and that matters because on-balance volume tracks whether money flow is generally accumulating despite day-to-day swings.
A quiet market can still be a dangerous one.
Key Levels & Scenarios
The nearest technical floor is 1,497.20, the 20-day support. That level matters because it sits below both moving averages and near the lower half of the recent band structure. If price slips back toward it, the market would be signalling that the current push has failed to hold above the short-term trend base. On the upside, 1,580.20 is the immediate resistance and also the latest intraday ceiling; a clear move through it would put the stock back into direct challenge of the 1,610.00 three-month high.
Because price is already near the top of the range, the burden of proof sits with the bulls. A move above 1,580.20 would need to be watched for follow-through, especially because the band squeeze suggests expansion could come quickly once the range breaks. If that level fails, the stock would likely drift back toward the 1,530.39 mid-band and SMA20 area, where short-term traders often reassess whether momentum is still intact.
Technical Verdict: HOLD (wait & see)
HOLD (wait & see)
- MACD is positive, showing momentum is still supportive.
- Price is above the SMA20 and SMA50, which keeps the short-term structure constructive.
- Stochastic is overbought and volume is only 0.7× normal, so the latest push lacks strong confirmation.
- Verdict invalidated if price falls below 1,497.20.
- Ideal Entry Range: 1,530.39 to 1,497.20
- Exit Target: 1,580.20, with 1,610.00 as the next chart reference
- Stop Loss protection: below 1,486.74
For non-traders: HSBC is still trending positively, but it is close enough to resistance that the next move matters more than the last one.
As of 7 September 2026 14:00 WIB, the stock’s latest printed resistance is 1,580.20.
Summary Data HSBC
| Last price | 1,574.80 GBp |
| Change 1 day / 5 days / 1 month | -0.34% / 3.04% / 2.98% |
| Trend / MA-cross | sideways / none |
| SMA20 / SMA50 | 1,530.39 / 1,513.63 |
| RSI (14) / Stochastic %K | 64.4 / 93.3 |
| Bollinger %B / ATR | 101% / 25.60 |
| Support / Resistance 20 days | 1,497.20 / 1,580.20 |
| Data as of | 7 September 2026 14:00 WIB |
Track HSBC share price daily: live levels, support/resistance and our full HSBC analysis history.



