Singtel Stock Analysis: Drops 0.44%, Golden Cross Formed
On September 9, 2026: price 4.54 SGD, trend uptrend, RSI 58.5, support 4.25, resistance 4.56. technical analysis of singtel stock. Singtel Stock Analysis —…
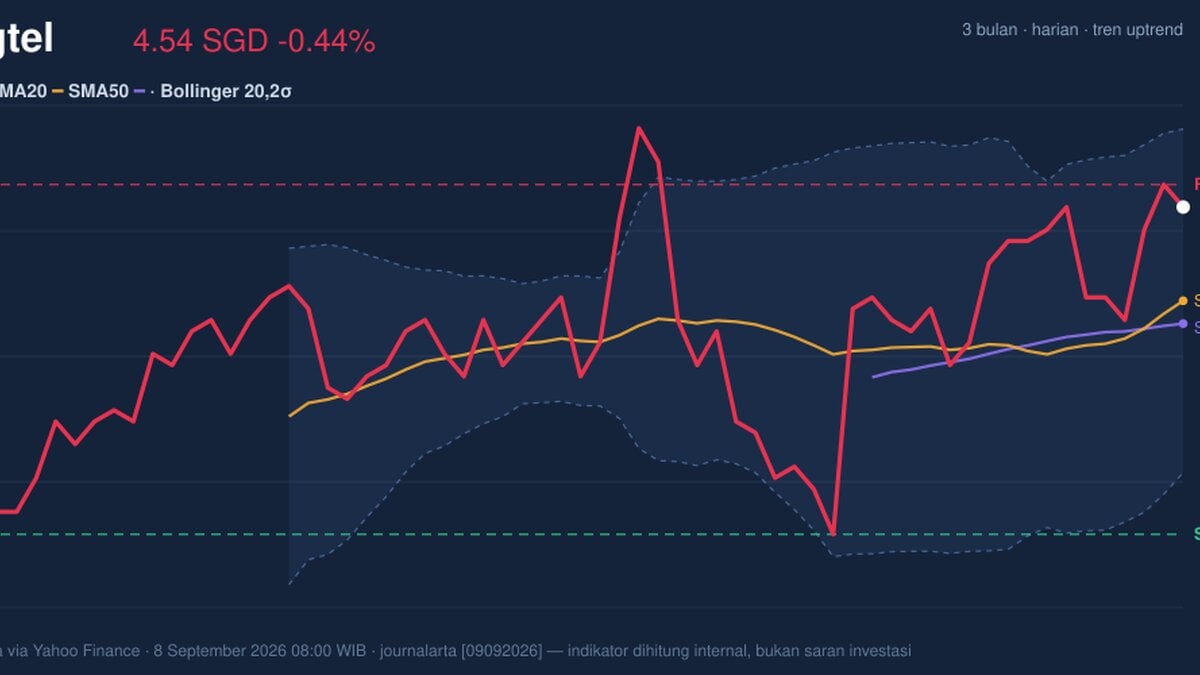
Singapore Telecom (Singtel) edged down to 4.54 SGD on SGX in Singapore, slipping 0.44% from the previous close even as the broader technical picture still points to an established uptrend. The stock is trading above both its SMA20 at 4.46 and SMA50 at 4.44, while the moving averages have already formed a golden cross, a signal that short-term momentum has moved ahead of the medium-term trend. In plain terms, the share price is no longer fighting the trend; it is sitting inside it, but near a zone where traders usually watch for either a clean extension or a pause.
Trend & Price Action
The chart shows Singtel holding a constructive structure, with the price above the short- and medium-term averages and the SMA20 rising at 0.89% over 5 days. That slope matters because it suggests the recent advance is not just a one-day bounce; it reflects sustained buying pressure over several sessions. The stock is also near the upper half of its recent range, with the latest price at 94% of the 20-hour range, which means the market is not pricing in distress — it is pricing in strength, but close to a ceiling.
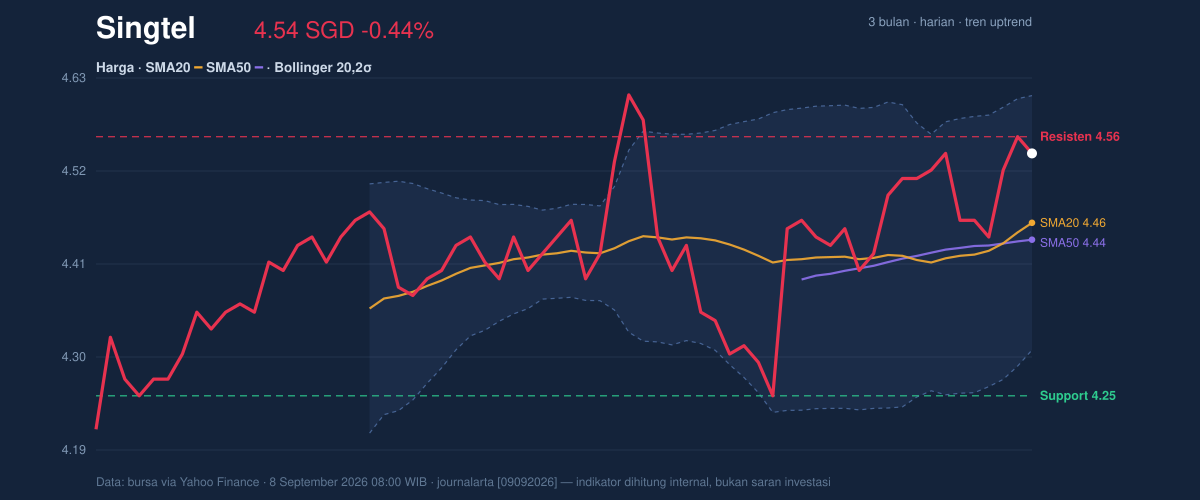
The most relevant reference points are clear. 4.56 is the immediate resistance from the 20-hour range, while 4.25 is the nearby support. That spread is important because it frames the current move as a test of whether buyers can absorb supply near the top of the range. The stock’s 3-month high of 4.70 is the next obvious upside marker, and the 3-month low of 4.15 shows where the trend would start to look damaged if momentum fades.
Oscillators & Momentum
Momentum indicators are supportive, but not yet screaming overheated. RSI at 58.5 is best read as neutral-to-firm: it signals positive momentum, yet leaves room for further upside before the stock enters a more stretched condition. That matters because a reading in this zone usually means the trend still has breathing room rather than being exhausted.
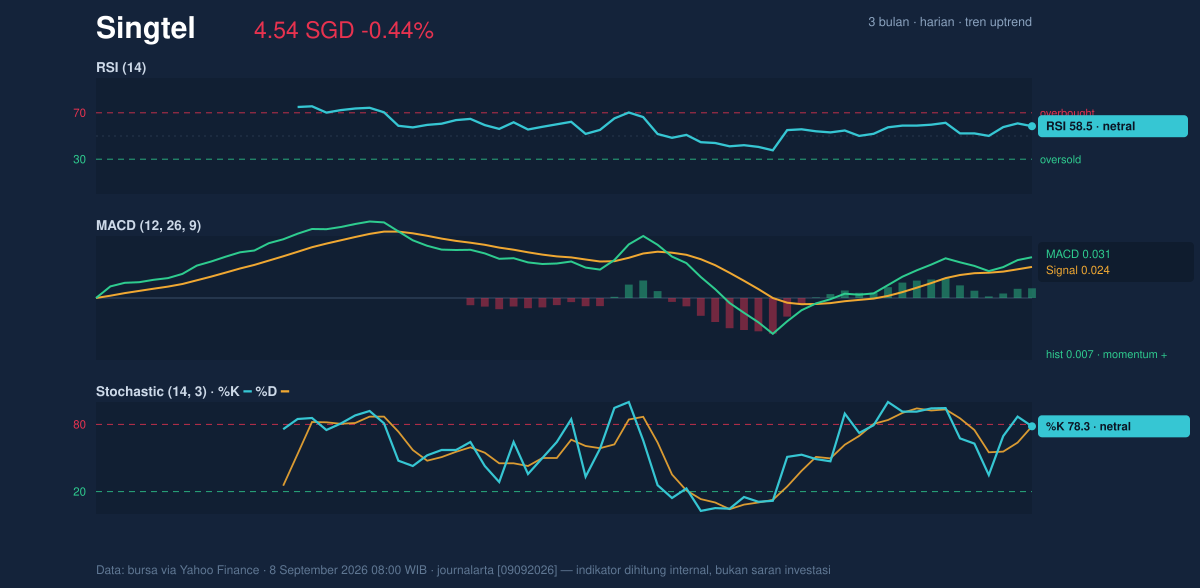
The stochastic oscillator, with %K at 78.3 and %D at 78.3, is also neutral, though it is sitting near the upper end of its scale. In practical terms, that tells readers the stock has already advanced enough to attract attention, but it has not clearly rolled over. The MACD at 0.031 above its signal at 0.024, with a positive histogram of 0.007, adds the more important confirmation: trend momentum remains positive. MACD is useful here because it shows the pace of the move, and the positive spread indicates the recent price advance is still being backed by underlying strength rather than fading impulse.
Volatility & Volume
Bollinger Bands are sending a subtle but important message. The upper band sits at 4.61, the middle band at 4.46, and the lower band at 4.30, with %B at 77%. That placement means the price is trading closer to the upper band than the middle, which is consistent with a firm trend. More importantly, the 6.8% band width is described as a squeeze, or narrowing of volatility. A squeeze often signals the market is storing energy; it does not predict direction on its own, but it does imply the next decisive move could be sharper than recent trading.
ATR reinforces that reading. At 0.07, or 1.6% of price, daily volatility is moderate rather than explosive. That combination — a squeeze in Bollinger Bands with middling ATR — suggests the stock is not yet in a high-noise phase, but it may be preparing for a larger directional move if resistance gives way.
Volume is the one area that tempers the bullish tone. Last volume of 13,088,300 was only 0.5x the 20-session average of 23,850,830, so the latest advance came on light participation. That matters because price gains on thin volume can be less convincing than gains backed by broad trading. Still, OBV is rising, which means cumulative volume flow has continued to improve even if the latest session itself was quiet. In other words, the broader participation trend still leans constructive.
Key Levels & Scenarios
The current setup is best understood as a compression near resistance. 4.56 is the first level the market has to clear to show that the recent uptrend is still extending rather than stalling. If that level is taken out, the chart points toward the next visible supply zone near the 4.61 Bollinger upper band, and then the 4.70 three-month high. If the price fails to hold the lower end of the recent structure, 4.46 becomes the first line of defense, followed by 4.30 and then 4.25.
The key signal to watch is whether the stock can convert a narrow range and a rising trend into a breakout with stronger volume. If it cannot, the current rally may simply continue to drift sideways above support while momentum resets. If it can, the chart has room to challenge the prior high.
Technical Verdict: HOLD (wait & see)
HOLD (wait & see)
- MACD is positive, and the histogram remains above zero, so trend momentum is still constructive.
- Price is above SMA20 and SMA50, with a golden cross confirming the broader trend structure.
- Bollinger Bands are squeezing, which raises the chance of a sharper move, but volume is only 0.5x average, so confirmation is still missing.
Verdict invalidated if price breaks below 4.25.
- Ideal Entry Range: 4.46 to 4.50, near the SMA20 and Bollinger middle band, where trend support is visible.
- Exit Target: 4.61 to 4.70, using the upper Bollinger band and the 3-month high as reference levels.
- Stop Loss protection: 4.25, below the nearest support and the recent range floor.
For non-traders: the chart says Singtel is still technically healthy, but it needs stronger volume to prove the next leg higher is real.
Summary Data Singtel
| Last price | 4.54 SGD |
| Change 1 day / 5 days / 1 month | -0.44% / 1.79% / 5.34% |
| Trend / MA-cross | uptrend / golden |
| SMA20 / SMA50 | 4.46 / 4.44 |
| RSI (14) / Stochastic %K | 58.5 / 78.3 |
| Bollinger %B / ATR | 77% / 0.07 |
| Support / Resistance 20 days | 4.25 / 4.56 |
| Data as of | 8 September 2026 08:00 WIB |
Track Singtel share price daily: live levels, support/resistance and our full Singtel analysis history.



