Testing Key Resistance, UOB Stock Drops 0.36% Today
On September 9, 2026: price 41.60 SGD, trend sideways, RSI 49.9, support 40.22, resistance 42.01. technical analysis of uob stock. Testing Key Resistance —…
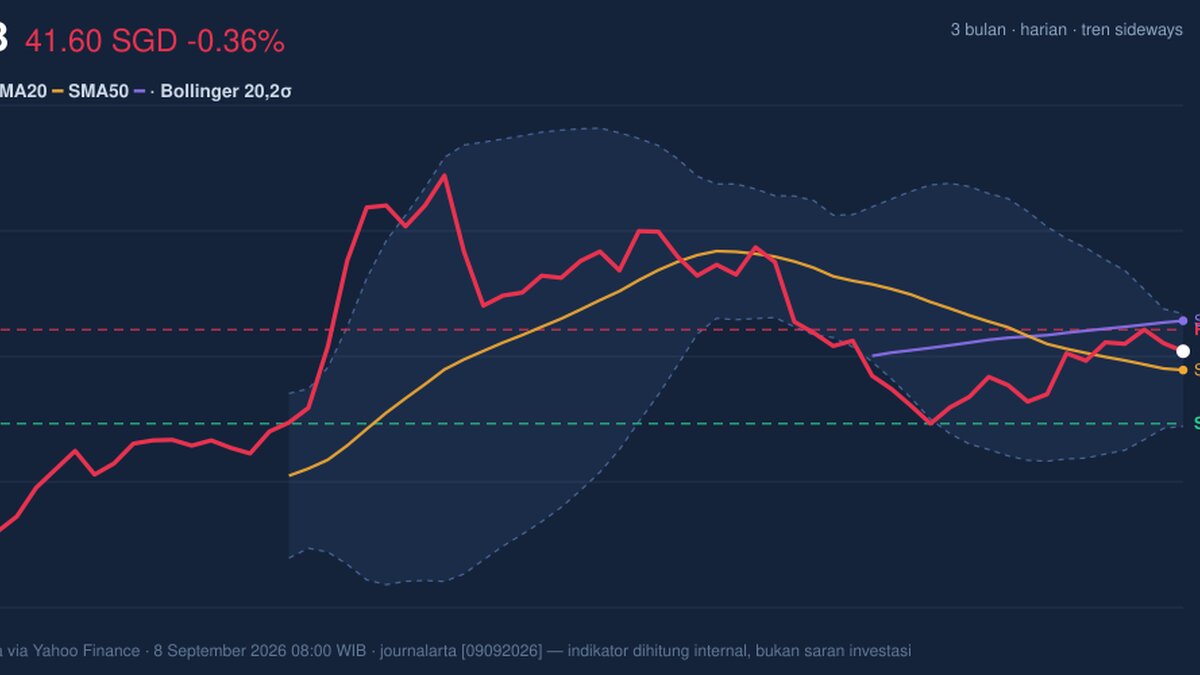
United Overseas Bank slipped to SGD 41.60 on SGX in the latest session, down 0.36% from the previous close of SGD 41.75, as the share price hovered in the upper half of its recent trading band rather than breaking decisively in either direction. The chart points to a market that is still digesting its earlier move: price is above the 20-day moving average at SGD 41.24 but below the 50-day moving average at SGD 42.18, a setup that usually signals a stock in transition, not a clear trend. In plain terms, UOB is holding up better than its short-term average, yet it has not reclaimed the longer-term line that often marks firmer bullish control.
Trend & Price Action
The broader pattern is best described as sideways, with the 20-day moving average sloping down by 0.78% over five days. That matters because a falling short-term average suggests recent trading has been slightly softer, even if the latest price is still sitting above it. The absence of a fresh moving-average cross also tells investors that the market has not produced a new structural signal; there is no clean shift from weakness to strength, or vice versa, yet.
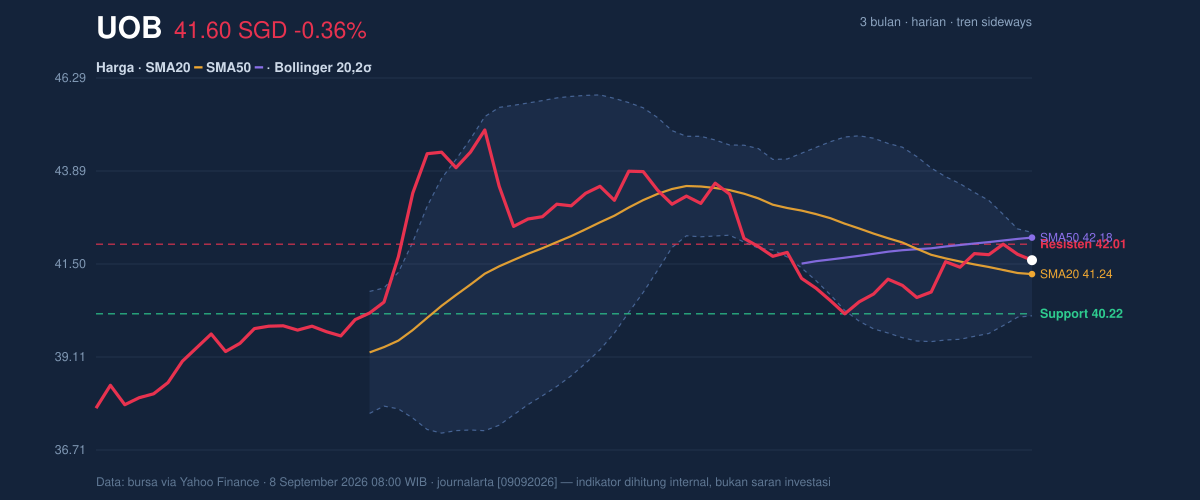
Price is trading at about 77% of the 20-day range, which means it is closer to the top than the bottom of the recent band, but not so close that a breakout is already confirmed. The stock’s 3-month high of SGD 45.15 and 3-month low of SGD 37.52 frame the larger battleground: UOB remains well above the lower end of that range, but still has room to recover before it revisits the upper extreme. The immediate message from the chart is not momentum collapse; it is consolidation beneath a heavier overhead zone.
Oscillators & Momentum
Momentum indicators are sending a mixed but constructive message. The RSI at 49.9 is effectively neutral, which means the stock is neither stretched to the upside nor washed out on the downside. That neutrality often appears when a share is waiting for a catalyst, and it fits the sideways price structure well. The Stochastic oscillator at %K 68.4 and %D 75.5 is also neutral, but leaning a little firmer than RSI; this suggests the share has some short-term lift, though not enough to call it overbought.
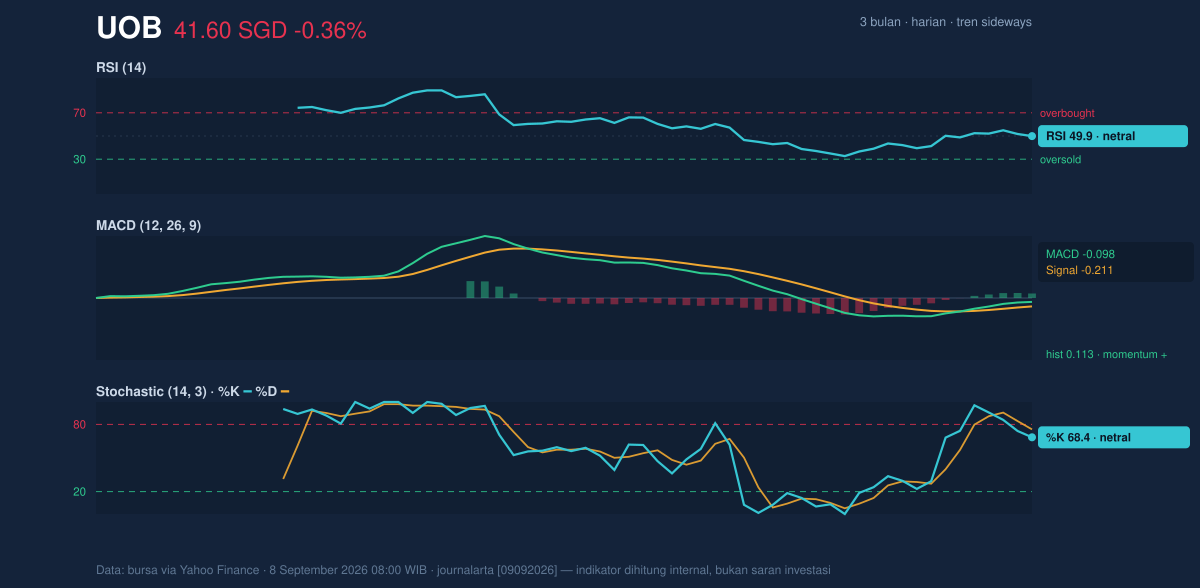
The more encouraging signal comes from MACD at -0.098 versus signal -0.211, with a positive histogram of 0.113. In simple terms, MACD is still below zero, so the broader trend has not fully turned positive, but the fact that it sits above its signal line means downside pressure has eased and near-term momentum has improved. That divergence between a still-negative MACD reading and a positive histogram is often what early recovery phases look like: the stock is not yet strong, but it is no longer losing ground as quickly.
Volatility & Volume
Volatility is subdued. The ATR(14) at 0.51, equal to 1.2% of price, indicates relatively low day-to-day movement. Low ATR often compresses the trading range and can precede a larger move, especially when paired with a narrowing Bollinger Band structure. Here, the Bollinger Band width is 5.2% and is squeezing, which usually means the market is coiling rather than trending cleanly. The price sits with %B at 67%, above the midpoint of the band and not far from the upper rail at SGD 42.31. That positioning suggests buyers have the upper hand in the short term, but not strongly enough to force a breakout on their own.
Volume, however, is quieter than usual. Last session’s turnover of 1,966,100 was only 0.7x the 20-day average of 2,967,810. That matters because a move on thin participation is less convincing than one backed by broad trading interest. Even so, OBV is rising, which implies that accumulated buying pressure has not disappeared; it is just not showing up in force yet. In other words, the chart shows interest, but not urgency.
Key Levels & Scenarios
The nearest technical floor is the 20-day support at SGD 40.22, while the first ceiling is the 20-day resistance at SGD 42.01. The market is currently trading between those two levels, which makes this a range-bound setup with a slight upward tilt because price is closer to resistance than support. If UOB can push through SGD 42.01 and then hold above the 50-day moving average at SGD 42.18, the chart would start to look more constructive, especially given the positive MACD histogram and rising OBV. If it fails to hold SGD 40.22, the squeeze would likely resolve lower, and the market could begin probing the lower part of the broader three-month range.
The core signal is a stock that is not trending strongly, but is quietly improving beneath a compressed volatility band. That combination often produces a sharper move once a boundary gives way, yet until that happens, the chart remains a waiting game rather than a confirmed directional break.
Technical Verdict: HOLD (wait & see)
HOLD (wait & see)
- MACD is improving with a positive histogram, but the line remains below zero, so momentum has turned better without fully confirming a bullish trend.
- Price is above SMA20 but below SMA50, which signals a mixed structure rather than a decisive trend reversal.
- Bollinger Bands are squeezing and ATR is low, pointing to compressed trading that often needs a breakout trigger before direction becomes clearer.
Verdict invalidated if price breaks below SGD 40.22.
- Ideal Entry Range: SGD 40.22 to SGD 41.24
- Exit Target: SGD 42.01 to SGD 42.31
- Stop Loss protection: below SGD 40.22
For non-traders, this means UOB looks steady but undecided: the chart is improving, yet it still needs a clean move through resistance before the next direction becomes clearer.
Summary Data UOB
| Last price | 41.60 SGD |
| Change 1 day / 5 days / 1 month | -0.36% / 0.43% / -1.33% |
| Trend / MA-cross | sideways / none |
| SMA20 / SMA50 | 41.24 / 42.18 |
| RSI (14) / Stochastic %K | 49.9 / 68.4 |
| Bollinger %B / ATR | 67% / 0.51 |
| Support / Resistance 20 days | 40.22 / 42.01 |
| Data as of | 8 September 2026 08:00 WIB |
Track UOB share price daily: live levels, support/resistance and our full UOB analysis history.



