XOM Stock Analysis: Gains 0.75%, Momentum Weakens
On September 9, 2026: price 160.66 USD, trend sideways, RSI 52.9, support 156.44, resistance 166.15. technical analysis of xom stock. XOM Stock Analysis — full…
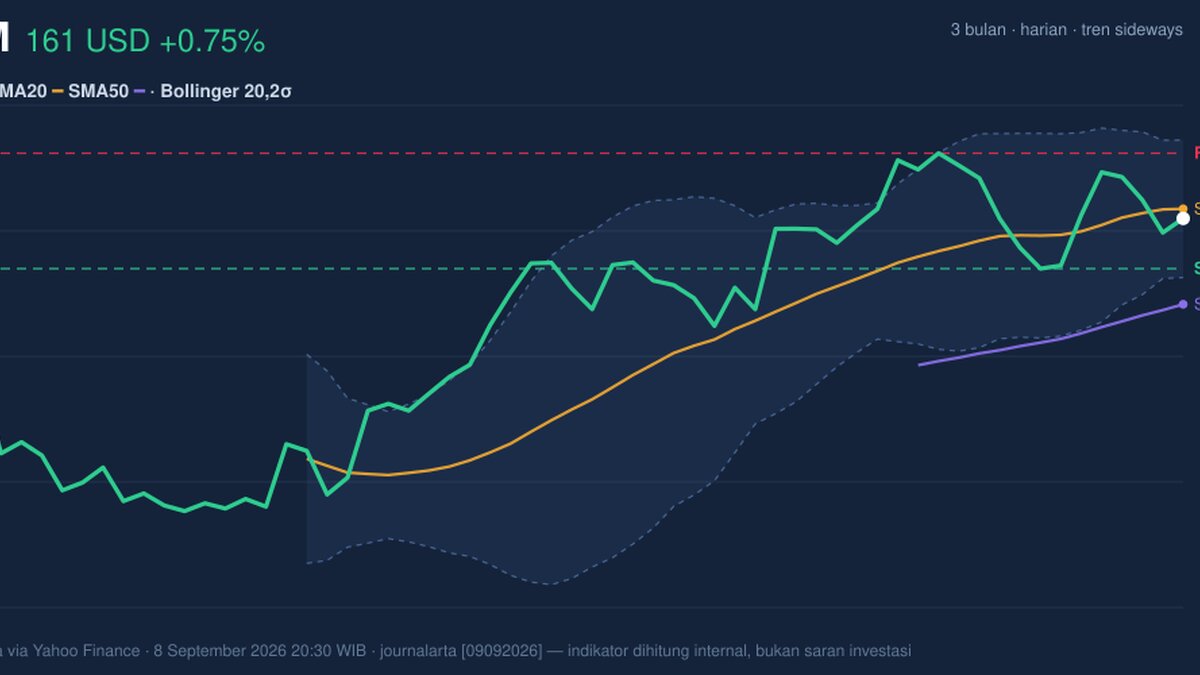
ExxonMobil’s shares on the NYSE rose to 160.66 USD on 8 September 2026, but the move still leaves the stock sitting just below its 20-day average of 161.47 and well above the 50-day average of 153.44, a combination that points to a market that is holding up, but not yet breaking decisively in either direction. The broader read from the chart is a sideways trend: buyers have enough strength to keep the price above the longer trend line, while short-term momentum has not fully reclaimed control. That is the kind of setup traders often describe as “coiling” — not because the stock is weak, but because it is waiting for a catalyst to resolve the tension between support and resistance.
Trend & Price Action
As shown in the chart, XOM is trading in the middle of its recent range, with the price at 43% of the 20-hour range between 156.44 support and 166.15 resistance. That placement matters because it suggests the market is neither oversold nor stretched; it is balanced, and balance often precedes a break in one direction once volume returns. The stock’s 1-day gain of 0.75% is a modest rebound, but the 5-day change of -0.18% shows the recovery has not yet become a sustained advance. The SMA20 slope of 1.18% over 5 days still leans upward, which tells us the short-term trend is stabilizing rather than rolling over, even though price remains below the SMA20. The lack of a fresh MA-cross also means there is no new trend signal from the moving averages — just a market sitting between a near-term ceiling and a deeper, more durable floor.
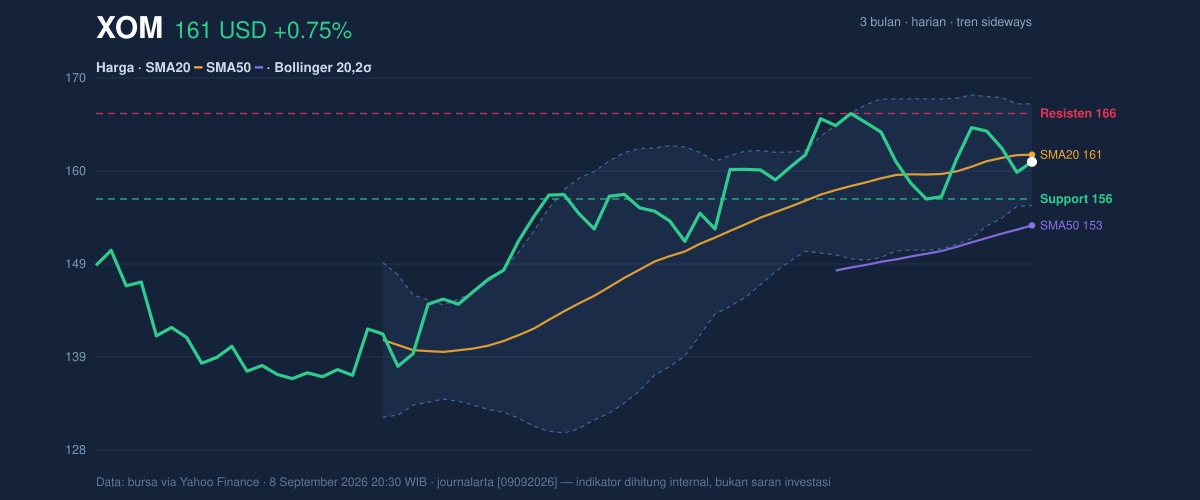
The Bollinger Bands sharpen that picture. With the upper band at 167.24, the middle band at 161.47, and the lower band at 155.69, price is hovering just under the midline, while the %B reading of 43% shows it is closer to the lower half of the band than the upper half. In plain language, the stock is not trading with strong upside pressure yet. At the same time, the 7.2% band width is relatively tight and described as a squeeze, which often means volatility has compressed and a larger move may be building. That does not tell direction by itself, but it does explain why the current calm may not last.
Oscillators & Momentum
Momentum indicators are mixed, and that is the clearest reason the chart does not yet qualify as a clean trend breakout. The RSI at 52.9 is neutral, which means the stock is neither overbought nor oversold and has room to move either way. The Stochastic %K at 40.1 and %D at 41.0 also sit in neutral territory, signaling that short-term momentum is neither strongly accelerating nor deeply washed out. In other words, the oscillators are not waving a clear bullish or bearish flag; they are waiting for price to choose a direction.
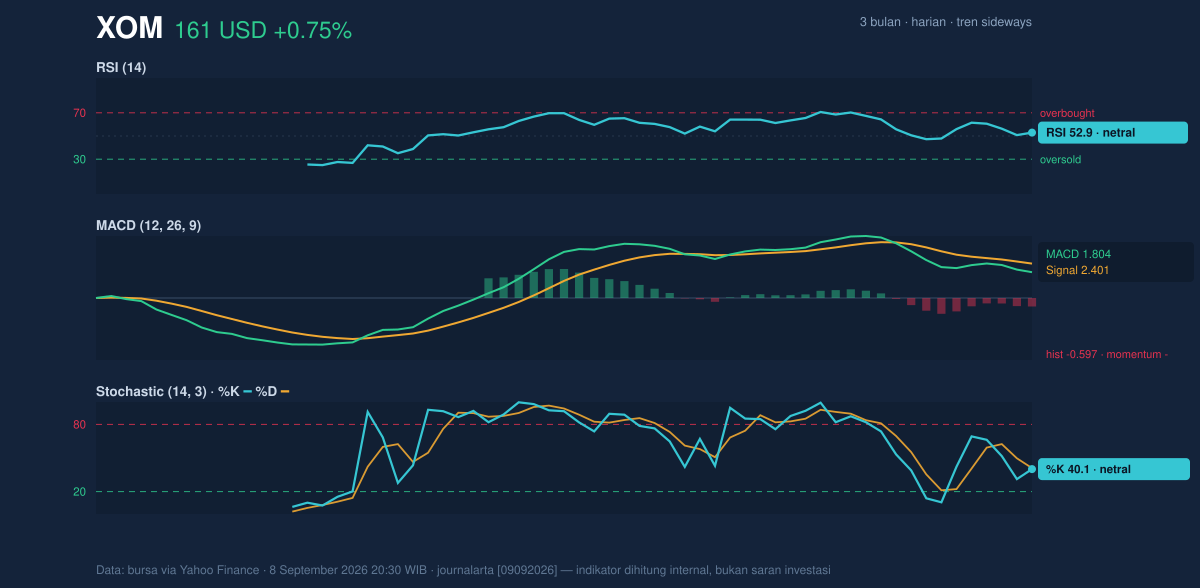
The more cautionary signal comes from MACD. With MACD at 1.804, signal at 2.401, and a histogram of -0.597, momentum is still negative even though the broader trend has not broken down. That gap between MACD and its signal line means recent price action has lost some upward energy. It does not automatically imply a reversal, but it does mean the stock is not yet generating the kind of momentum that usually accompanies a decisive push through resistance. When MACD is negative while RSI and Stochastic are neutral, the message is usually simple: the market is drifting rather than committing.
Volatility & Volume
Volatility is moderate, with ATR at 3.34, or about 2.1% of price. That gives a practical sense of how far XOM can reasonably move in a normal session without changing the broader structure. The key point is that the stock has enough daily range to test nearby levels, but not so much turbulence that the chart is unstable. Combined with the squeezed Bollinger Bands, this suggests the market may be preparing for a larger directional move once participation improves.
Volume, however, is not confirming a breakout attempt. The latest volume of 12,607,700 was below the 20-day average of 13,688,190, or about 0.9x normal. That matters because breakouts built on light volume often fade quickly; institutions typically leave a stronger footprint when a move has conviction. The OBV is falling, which means volume has been more supportive of distribution than accumulation in recent sessions. That is not a collapse signal, but it does tell readers that underlying participation has been softer than the price chart alone might suggest.
Key Levels & Scenarios
The immediate battleground remains clear. The first line of defense is 156.44 support, which aligns closely with the lower Bollinger band at 155.69. If that zone holds, the chart keeps its sideways-to-stabilizing character. If it fails, the stock would be vulnerable to a deeper retracement toward the lower end of the 3-month range, which extends down to 134.95. On the upside, 166.15 resistance is the first test, and then 167.24 at the upper Bollinger band becomes the next technical ceiling. A move through that area would matter because it would show the squeeze is resolving with upward force rather than just a short-lived bounce. The 3-month high of 168.64 is the broader reference point that would confirm the market has regained the upper part of its recent range.
Technical Verdict: HOLD (wait & see)
HOLD (wait & see)
- MACD is negative with the histogram below zero, which argues against calling the move constructive too early.
- Price is below the SMA20 even though the SMA20 slope is still rising, a sign of stabilization rather than confirmed strength.
- Volume is 0.9x normal and OBV is down, so participation is not yet strong enough to validate a breakout.
Verdict invalidated if price falls below 156.44, because that would break the nearest support and weaken the current range structure.
- Ideal Entry Range: 156.44 to 161.47
- Exit Target: 166.15 to 167.24
- Stop Loss protection: 155.69
In plain English: the chart says ExxonMobil is holding its ground, but it has not yet shown enough momentum to prove the next move is up. The next scheduled test is whether the stock can reclaim 166.15 and then challenge 167.24.
Summary Data XOM
| Last price | 160.66 USD |
| Change 1 day / 5 days / 1 month | 0.75% / -0.18% / 0.54% |
| Trend / MA-cross | sideways / none |
| SMA20 / SMA50 | 161.47 / 153.44 |
| RSI (14) / Stochastic %K | 52.9 / 40.1 |
| Bollinger %B / ATR | 43% / 3.34 |
| Support / Resistance 20 days | 156.44 / 166.15 |
| Data as of | 8 September 2026 20:30 WIB |
Track XOM stock price daily: live levels, support/resistance and our full XOM analysis history.



