AIA Stock Gains 0.07%, Testing Key Resistance In Focus
On September 10, 2026: price 76.95 HKD, trend sideways, RSI 58.3, support 70.40, resistance 77.50. technical analysis of aia stock. AIA Stock Gains — full…
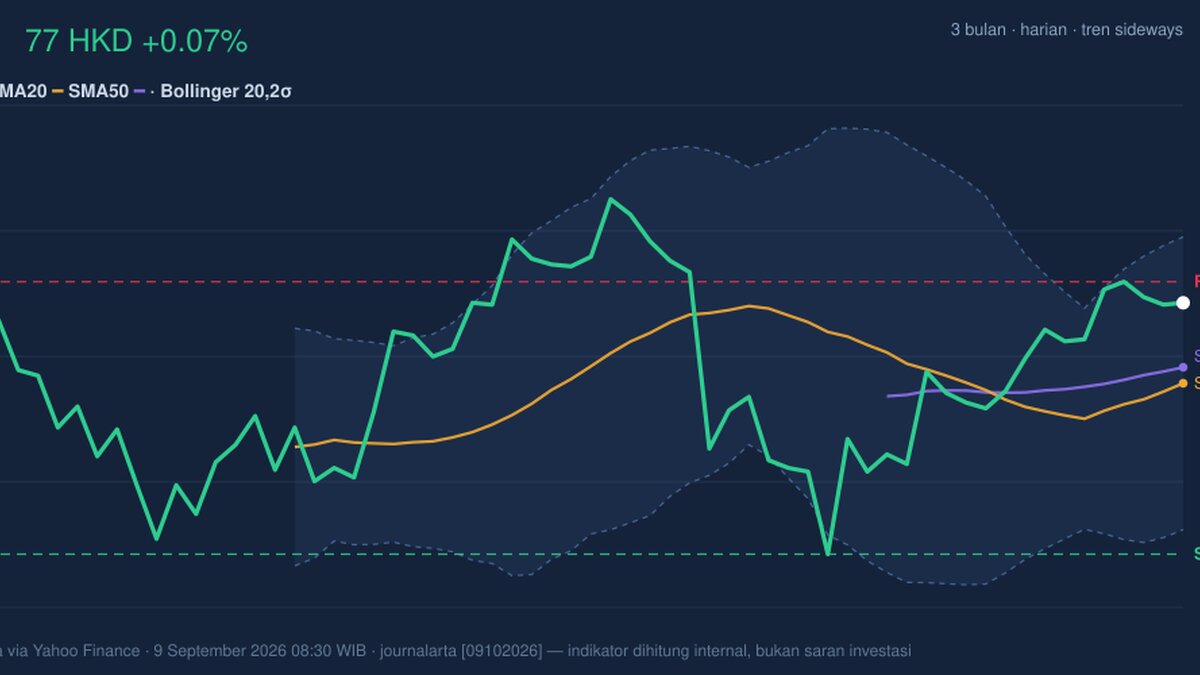
76.95 HKD was little changed in Hong Kong trading, but the tape still leaned firmer: AIA Group’s share price sat above both its SMA20 at 74.85 and SMA50 at 75.27, while the latest move left the stock close to the top of its 20-day range. That matters because it suggests the market is not chasing the name aggressively, yet it is also not treating the recent bounce as a dead-cat rebound. The share is now trading with a mild upward bias inside an otherwise sideways structure, and that combination often signals consolidation rather than a clean breakout.
Trend & Price Action
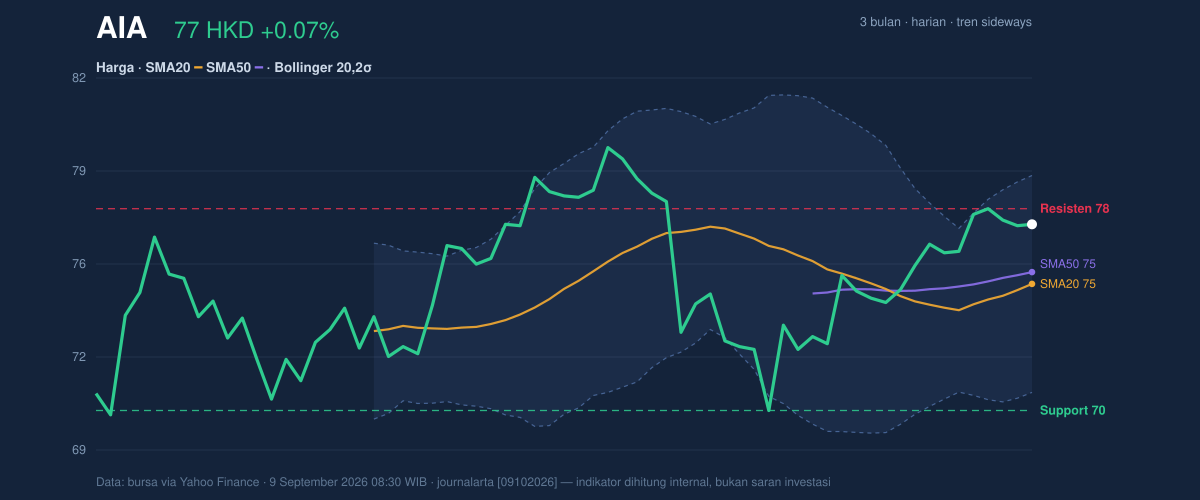
The most important message from the chart is that AIA is holding above its short- and medium-term trend markers without a fresh moving-average crossover. As shown in the chart, the price remains above SMA20 and SMA50, which is a constructive setup, but the absence of a new MA-cross means the market has not yet produced a stronger trend signal. In plain terms, the shares have recovered enough to keep buyers engaged, yet not enough to prove a decisive trend change. The stock is also sitting at 92% of its 20-hour range, which places it near the upper end of recent trading and explains why momentum may need fresh volume to extend further.
The broader 3-month band gives that move more context. AIA has traded between 69.05 and 80.15, so the current level is closer to the upper half of that corridor than to the floor. That position does not scream breakout, but it does show the market has rebuilt some distance from the lower end of the range. The 20-day Bollinger middle band at 74.85 is especially important here: price above the mid-band usually means the market is regaining short-term control, while the upper band at 78.67 becomes the next obvious test if buyers keep pressing.
Oscillators & Momentum
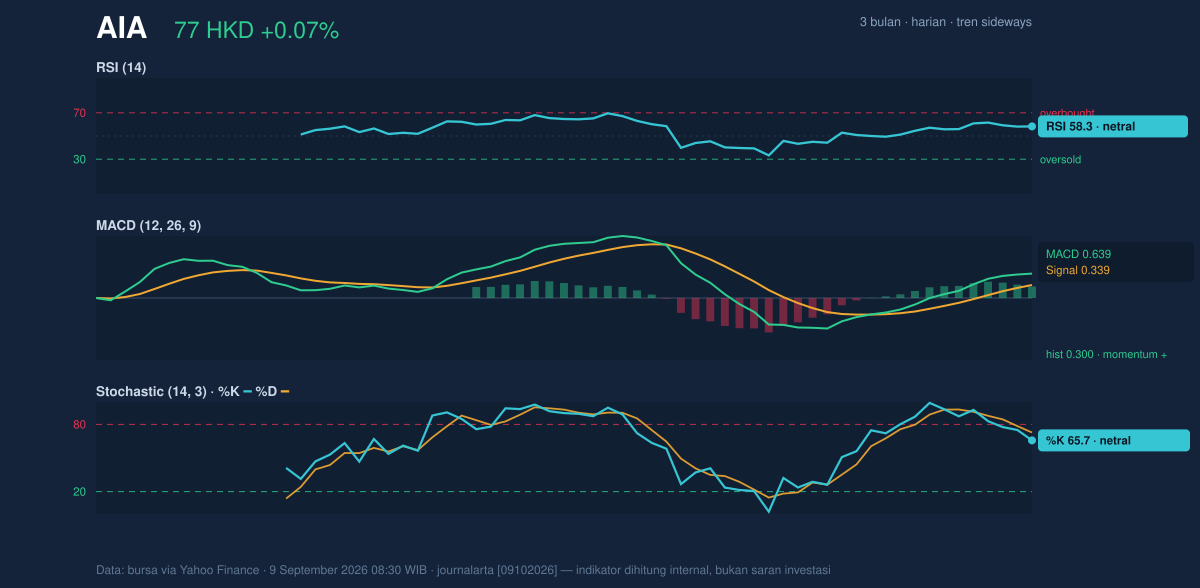
Momentum is supportive, though not overheated. The RSI at 58.3 sits in neutral territory, which tells readers the shares are neither stretched nor washed out. That is useful because it leaves room for follow-through without immediately triggering overbought concerns. The Stochastic %K at 65.7 and %D at 72.8 are also neutral, but the gap between the two lines suggests the short-term push has cooled a little from its strongest point. In other words, the stock has upward energy, but it is not accelerating hard enough to signal a runaway move.
The stronger message comes from MACD at 0.639 versus its signal line at 0.339, with a histogram of 0.300. That positive spread means recent price action is still outrunning the slower trend measure, a classic sign that momentum remains on the buyers’ side. It is not a dramatic reading, but it is enough to confirm that the rebound has internal support rather than being driven by a one-day spike. As shown in the chart, the oscillators are aligned in a broadly constructive way, just not in a way that implies urgency.
Volatility & Volume
Volatility is moderate rather than explosive. The ATR(14) at 1.57, equal to 2.0% of price, implies the stock is still capable of moving meaningfully in a session, but not in the type of wide swings usually associated with panic or event risk. The Bollinger Band width of 10.2% is described as normal, which means the market is not in a squeeze that would often precede a sharp expansion, nor in a stretched state that would warn of exhaustion. With %B at 77%, price is trading in the upper portion of the band structure, reinforcing the idea that the stock is leaning upward, though not yet pressing against a volatility ceiling.
Volume adds a subtle but important nuance. Last turnover of 23,853,046 was below the 20-session average of 27,821,796, or 0.9× normal. That tells us the latest advance has not been powered by unusually strong participation. In technical terms, price is rising on acceptable but not emphatic demand. The fact that OBV is rising partially offsets that caution, because on-balance volume measures whether money flow is generally accumulating over time. A rising OBV alongside a price holding above key averages is usually a healthier sign than price alone, even if the day’s turnover was not exceptional.
Key Levels & Scenarios
The nearest technical ceiling is 77.50, the 20-hour resistance, and the Bollinger upper band at 78.67 sits just above it. Those two levels matter because they define whether the current recovery can become a more convincing advance. If price can clear 77.50 and stay above it, the next test would naturally shift toward the upper band and then the 3-month high at 80.15. That sequence would indicate the market is re-entering the upper part of its longer trading range, where supply has previously appeared.
On the downside, the first meaningful floor is 74.85, the Bollinger middle band and SMA20. That level is important because it acts as a short-term trend pivot. If the stock slips below it, the market would be saying the recent bounce has lost some traction. The broader support at 70.40 is the deeper line in the sand, and a break there would point back toward the 3-month low at 69.05. The current setup therefore hinges on whether AIA can keep trading above its mid-band support while volume gradually improves.
Technical Verdict: HOLD (wait & see)
HOLD (wait & see) — the chart is constructive, but not decisive enough to call for a stronger directional verdict.
- SMA20/SMA50 support: price is above both averages, which keeps the short-term structure positive.
- MACD positive: 0.639 versus 0.339 confirms momentum is still leaning upward.
- Volume is only 0.9× normal: the move lacks strong participation, so follow-through is not yet fully proven.
- Verdict invalidated if price falls below 74.85, because that would put the stock back under the short-term trend pivot.
Ideal entry range: 74.85 to 75.27
Exit target: 77.50 to 78.67
Stop loss protection: 70.40
In plain English: the stock is leaning upward, but it still needs stronger confirmation before the move looks settled.
Summary Data AIA
| Last price | 76.95 HKD |
| Change 1 day / 5 days / 1 month | 0.07% / 1.25% / 5.92% |
| Trend / MA-cross | sideways / none |
| SMA20 / SMA50 | 74.85 / 75.27 |
| RSI (14) / Stochastic %K | 58.3 / 65.7 |
| Bollinger %B / ATR | 77% / 1.57 |
| Support / Resistance 20 days | 70.40 / 77.50 |
| Data as of | 9 September 2026 08:30 WIB |
Track AIA share price daily: live levels, support/resistance and our full AIA analysis history.



