DBS Testing Key Resistance: Stock Drops 0.77% (September 10, 2026)
On September 10, 2026: price 77.50 SGD, trend uptrend, RSI 59.0, support 75.53, resistance 78.65. technical analysis of dbs stock. DBS Testing Key Resistance —…
DBS Group’s shares slipped to SGD 77.50 on 9 September 2026 at 08:00 WIB, down from the previous close of 78.10, but the move does not yet break the broader constructive pattern. The stock is still trading above its SMA20 at 76.75 and above its SMA50 at 74.06, which tells investors the medium-term trend remains intact even as short-term momentum cools. In plain terms, DBS is still climbing the staircase, but the latest step was a little shaky.
Trend & Price Action
The price sits in an uptrend, and the slope of the SMA20, rising at 0.85% over 5 days, shows the short-term trend is still pointing higher. The absence of a fresh MA-cross matters: there is no new moving-average trigger to suggest a trend reversal, so the tape is being guided more by steady trend persistence than by a dramatic breakout signal. As shown in the chart, the stock is also positioned at 63% of its 20-hour range, which means it is leaning toward the upper half of the band rather than testing the floor.
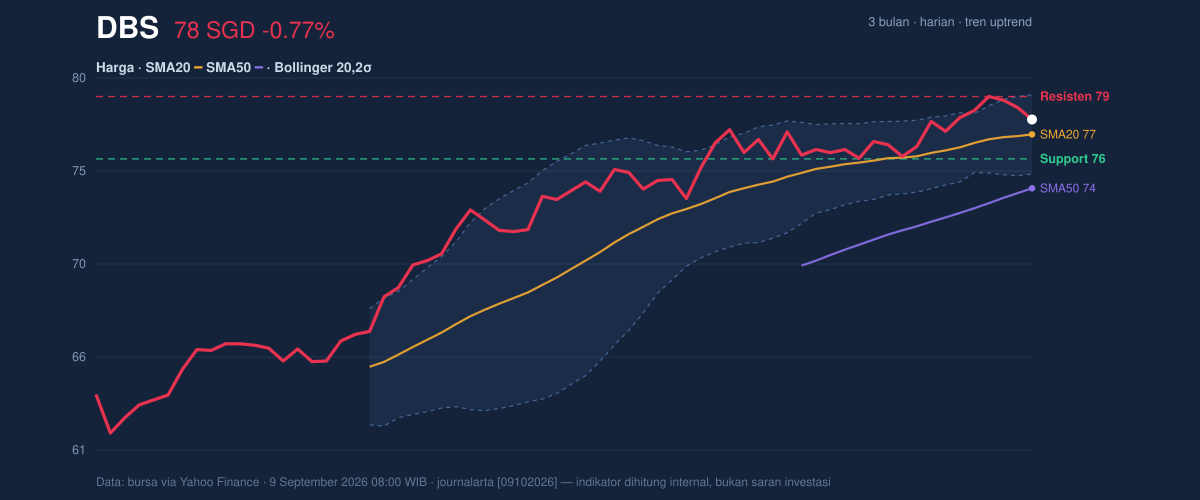
That placement is important. It suggests buyers have not lost control, but they are also not pressing aggressively enough to force a clean escape from the recent range. The 20-hour support at 75.53 is the first line that matters if the stock weakens further, while 78.65 is the near-term ceiling that has to give way before the chart can look more convincing. The broader 3-month range, from 61.60 to 79.05, shows DBS is already trading close to the upper end of that span. That usually means the easy part of the recovery may already be behind it.
A stock near the top of its range can be strong — or tired.
Oscillators & Momentum
Momentum is more mixed than the trend. The RSI at 59.0 is still neutral, which is a useful signal because it says the stock is neither overbought nor oversold. In other words, DBS has room to move either way without technical exhaustion flashing immediately. The Stochastic reading of 61.1 versus 74.2 is also neutral, but with %K below %D, it hints that the recent push has lost some speed. That is not a collapse signal; it is more of a pause signal.
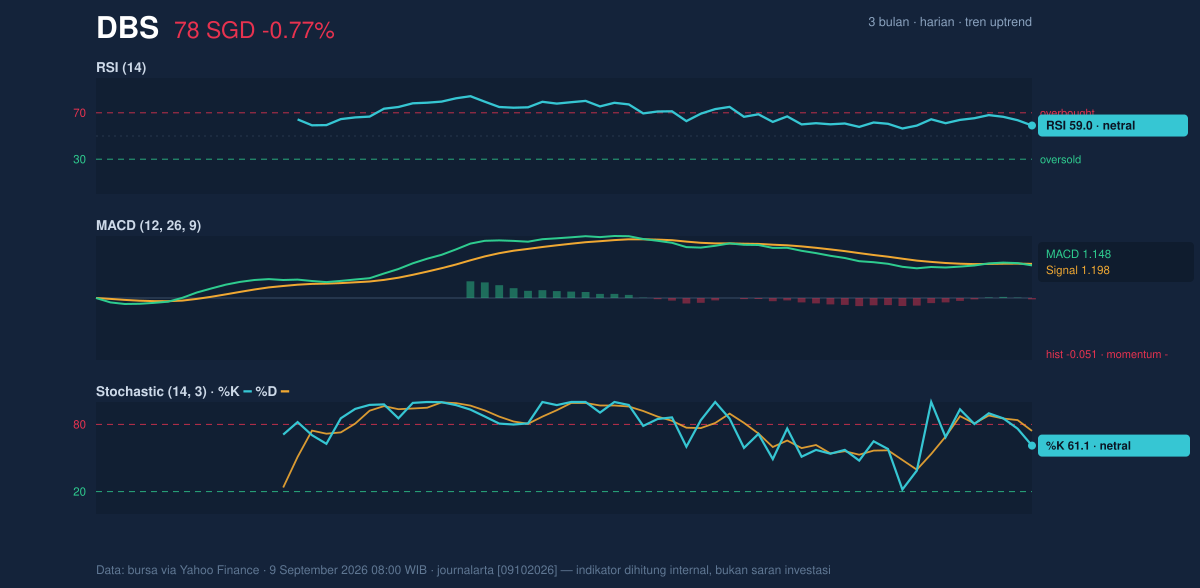
The sharper warning comes from MACD. The MACD at 1.148 remains above zero, which keeps the broader trend positive, but it is still below the signal line at 1.198, and the histogram at -0.051 is negative. For readers, that means the trend is still alive, but the rate of ascent has slowed enough for short-term momentum to turn slightly unfriendly. This is often what a mature advance looks like before either a pause or a fresh attempt at higher levels.
Volatility & Volume
Volatility is subdued. The ATR at 0.92, equal to 1.2% of price, points to a quiet market where daily swings are relatively contained. That matters because low ATR often precedes a larger move, especially when paired with a narrowing Bollinger Band. Here, the Bollinger bandwidth is 5.1% and is shrinking, a classic squeeze setup that can lead to a breakout once price chooses direction. The %B reading of 69% shows DBS is trading in the upper part of its band, which supports the idea that the stock is still biased upward even if it has not yet broken out.
Volume is not screaming conviction, but it is not weak either. Last volume of 3,791,700 versus the 20-hour average of 3,619,445 is only about 1.0x normal, so the latest dip was not accompanied by heavy selling pressure. More importantly, OBV is rising, which means cumulative volume flow still favors accumulation rather than distribution. That combination — stable volume, rising OBV, and a tight band — often suggests the market is waiting for a catalyst rather than abandoning the trend.
Quiet price action can be the prelude to a louder move.
Key Levels & Scenarios
The immediate map is clear. 75.53 is the first support to watch, and it sits just above the SMA20 at 76.75 after accounting for the recent pullback. If that area holds, the chart keeps its constructive shape. If it fails, the stock would likely be signaling that the recent uptrend is losing traction. On the upside, 78.65 is the first resistance, with the broader 3-month high at 79.05 marking the next obvious reference point. A move through those levels would matter because it would confirm that the squeeze is resolving in favor of buyers rather than fading into a range-bound drift.
The technical message is not that DBS is weak; it is that strength is becoming more selective. Trend followers will notice the price is still above both key moving averages, but momentum traders will notice the MACD has slipped under its signal line. That split often produces a waiting game until one side wins.
Technical Verdict: HOLD (wait & see)
HOLD (wait & see)
- Reason 1: Uptrend remains intact with price above the SMA20 at 76.75 and SMA50 at 74.06.
- Reason 2: Momentum is mixed — RSI 59.0 and Stochastic 61.1/74.2 are neutral, but MACD 1.148 is below the signal line at 1.198 with a -0.051 histogram.
- Reason 3: Bollinger Bands are squeezing at 5.1%, which often precedes a directional move, but not yet a confirmed one.
- Verdict invalidated if price falls below 75.53, because that would mean the nearest support has failed and the short-term structure is weakening.
- Ideal Entry Range: 75.53 to 76.75
- Exit Target: 78.65 to 79.05
- Stop Loss protection: below 75.53
For non-traders: DBS still looks technically healthy, but the chart is asking for confirmation before the next move becomes clear.
“The next move matters more than the last one.”
Summary Data DBS
| Last price | 77.50 SGD |
| Change 1 day / 5 days / 1 month | -0.77% / -0.13% / 2.18% |
| Trend / MA-cross | uptrend / none |
| SMA20 / SMA50 | 76.75 / 74.06 |
| RSI (14) / Stochastic %K | 59.0 / 61.1 |
| Bollinger %B / ATR | 69% / 0.92 |
| Support / Resistance 20 days | 75.53 / 78.65 |
| Data as of | 9 September 2026 08:00 WIB |
Track DBS share price daily: live levels, support/resistance and our full DBS analysis history.



