HSBC Stock Analysis: Gains 0.67%, Testing Key Resistance
On September 10, 2026: price 166.00 HKD, trend uptrend, RSI 59.6, support 160.30, resistance 167.60. technical analysis of hsbc stock. HSBC Stock Analysis —…
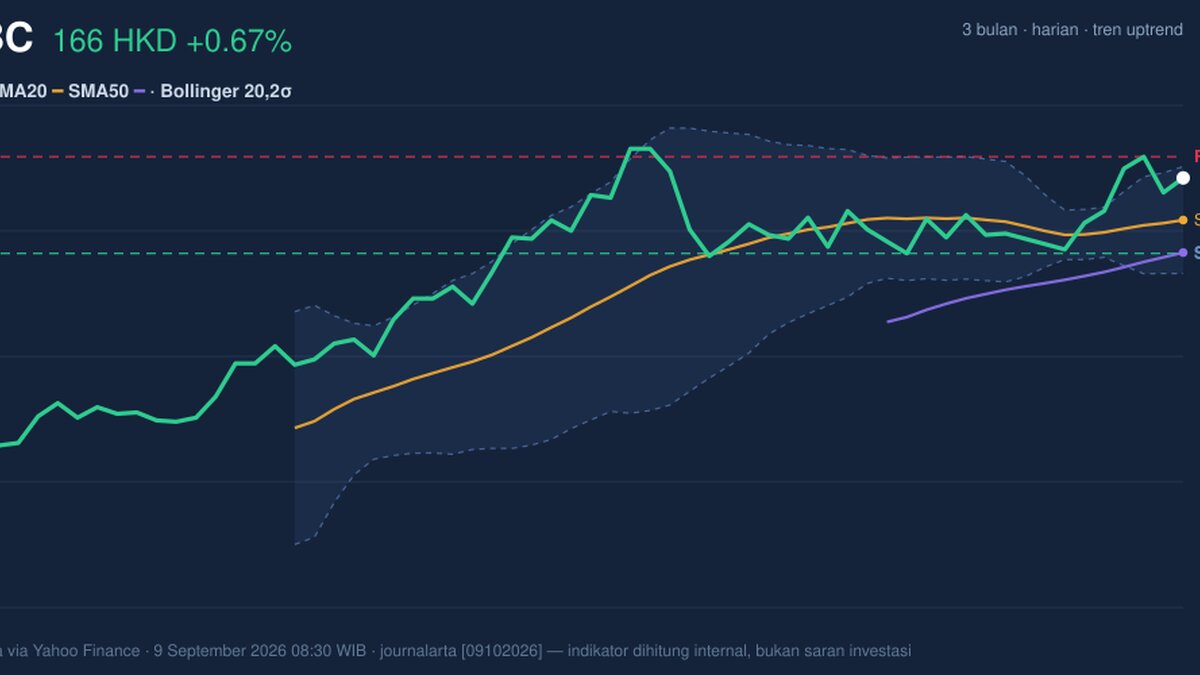
166.00 HKD is where HSBC Holdings’ Hong Kong-listed shares sat on 9 September 2026 at 08:30 WIB, up 0.67% from the previous close of 164.90. That keeps the stock in a steady short-term uptrend, but the more interesting signal is not the daily gain itself: it is that price is pressing into the upper end of its recent range while volatility remains unusually calm, a setup that can precede either a clean breakout or a pause.
Trend & Price Action
The chart shows HSBC trading above its SMA20 at 162.82 and above its SMA50 at 160.37, which is a straightforward sign that the short-term trend is still pointed higher. The SMA20’s positive slope of 0.67% over five days matters because it shows the average price itself is rising, not just the latest trade. In plain terms, momentum has been persistent enough to lift the baseline. There is no fresh MA cross, so this is not a new trend ignition; it is a trend that has already been in place and is now being tested near the top of the recent band.
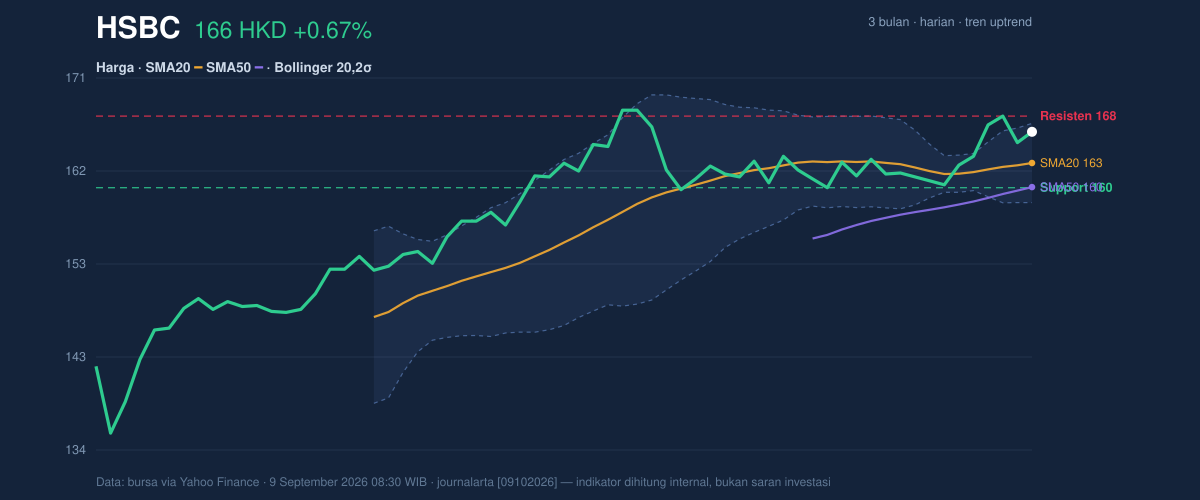
Price at 166.00 HKD is also sitting near the upper edge of the Bollinger framework, with the upper band at 166.85 and the stock at 78% of its 20-day range. That positioning tells readers the market is not cheap relative to its recent trading history, but it is also not yet decisively overextended. The 20-day support at 160.30 and resistance at 167.60 define the immediate battleground: the stock is close enough to resistance that traders will be watching whether buyers can force a close through that ceiling, or whether sellers defend it again.
A short move higher has already been priced in. What happens next matters more.
Oscillators & Momentum
The momentum picture is constructive, but not euphoric. RSI(14) at 59.6 is neutral, which means the stock has room to rise without immediately entering an overbought zone. That is important because a neutral RSI alongside a rising price often signals a trend that still has fuel, rather than one that is already stretched. Meanwhile, Stochastic %K at 79.1 and %D at 81.0 sit near the upper end of their scale, which suggests the stock is trading close to the top of its recent daily range and may be vulnerable to short pauses if buying slows.
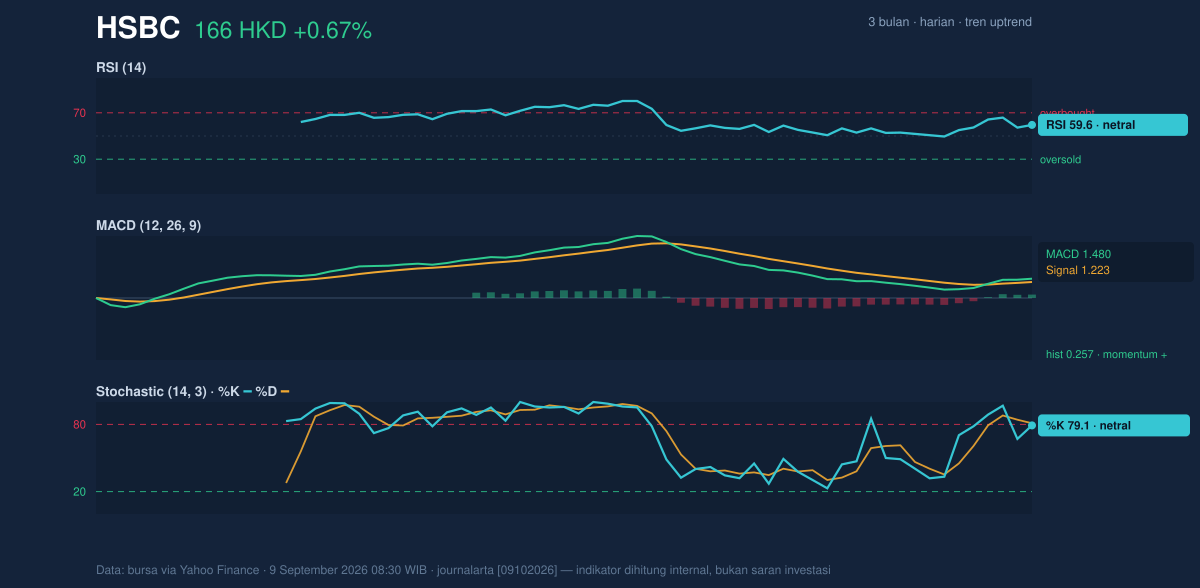
The cleaner bullish clue comes from MACD at 1.480 above its signal line at 1.223, with a positive histogram of 0.257. For general readers, MACD is a trend-following gauge: when it sits above the signal line, it implies recent price action is still stronger than the longer-running trend measure. In this case, the positive histogram shows that gap is still open, meaning the upward move has not yet fully faded. The signal is supportive, but not explosive — consistent with a market climbing rather than surging.
Volatility & Volume
The volatility backdrop is subdued. ATR(14) at 2.39, equal to 1.4% of price, points to relatively low day-to-day movement. That matters because low ATR often means the market is coiling rather than swinging widely. The Bollinger band width of 5.0% is also narrow, and the chart description flags a squeeze condition. In practical terms, a squeeze means the bands have tightened, which often reflects a period of compression before a larger directional move. Since price is already near the upper band, the market is leaning bullish — but a squeeze can break either way if demand fails to follow through.
Volume does not yet confirm a breakout. The latest volume of 6,256,877 is only 0.6x the 20-day average of 9,925,141, so the move higher is happening on lighter participation than normal. That is a caution flag: price is advancing, but not with obvious crowd conviction. Offsetting that, OBV is rising, which suggests the broader flow of trading has still been net supportive even if the most recent session was not especially heavy. In simple terms, buyers have been present over time, but they have not yet shown the force usually associated with a decisive breakout.
The chart is tight. The tape is not loud.
Key Levels & Scenarios
The immediate support sits at 160.30, with the stronger trend reference at the SMA20 of 162.82. If price loses that area, the market would be telling us the recent upward push is losing traction. On the upside, 167.60 is the nearest resistance, just under the Bollinger upper band at 166.85 and within reach of the current price. The 3-month high at 169.70 is the next visible ceiling if resistance gives way. The 3-month low at 133.50 remains far below and mainly serves as a reminder that the broader range is large enough to absorb several short-term swings.
For now, the signal is conditional: a sustained move above 167.60 would strengthen the case that the squeeze is resolving upward, while failure to hold 162.82 would weaken the trend structure and shift attention back toward 160.30.
Technical Verdict: HOLD (wait & see)
HOLD (wait & see)
- MACD remains positive, so trend momentum is still supportive.
- Price is above SMA20 and SMA50, confirming the short-term uptrend.
- Volume is only 0.6x normal, which limits confidence in any immediate breakout attempt.
- Verdict invalidated if price falls below 160.30, where near-term support and trend structure start to weaken.
Ideal technical levels:
- Entry Range: 162.82 to 166.00
- Exit Target: 167.60, then 169.70
- Stop Loss protection: 160.30
In plain English: HSBC’s chart still leans upward, but the latest rise has not yet been backed by enough volume to call it a clean breakout.
As of 9 September 2026 08:30 WIB, the 3-month high stands at 169.70 HKD.
Summary Data HSBC
| Last price | 166.00 HKD |
| Change 1 day / 5 days / 1 month | 0.67% / 2.09% / 2.85% |
| Trend / MA-cross | uptrend / none |
| SMA20 / SMA50 | 162.82 / 160.37 |
| RSI (14) / Stochastic %K | 59.6 / 79.1 |
| Bollinger %B / ATR | 89% / 2.39 |
| Support / Resistance 20 days | 160.30 / 167.60 |
| Data as of | 9 September 2026 08:30 WIB |
Track HSBC share price daily: live levels, support/resistance and our full HSBC analysis history.



