META RSI Overbought: Stock Gains 6.55% (September 10, 2026)
On September 10, 2026: price 653.69 USD, trend sideways, RSI 70.5, support 543.67, resistance 653.69. technical analysis of meta stock.
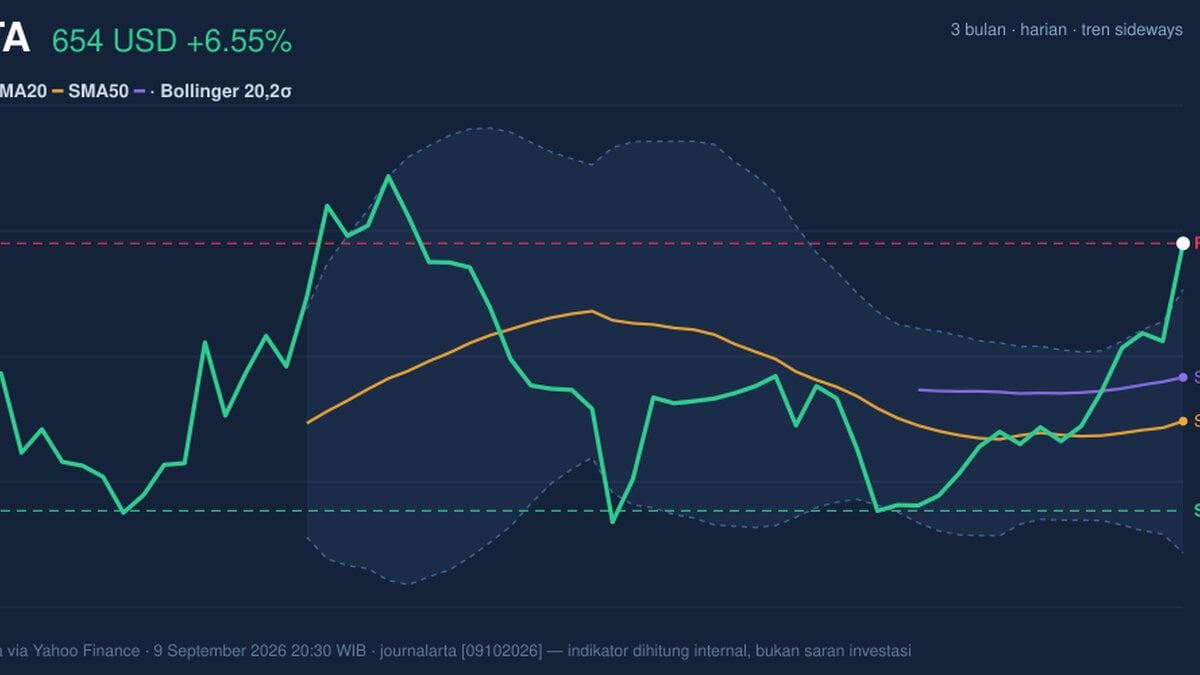
Meta Platforms surged to 653.69 USD on 9 September 2026, a sharp 6.55% daily gain that pushed the stock to the very top of its recent trading range, according to Yahoo Finance data via the exchange feed. The move matters because it is not just a price pop: it arrived with volume at 35,843,200, or 2.1 times the 20-session average, which suggests real participation rather than a thin, speculative jump. Yet the chart also shows a more complicated message — momentum is strong, but it is now stretched.
Trend & Price Action
The broader structure remains sideways, even after the latest rally. That may sound contradictory, but it is a useful signal: the stock has not yet broken into a clean new trend, even though it is trading well above both SMA20 at 580.54 and SMA50 at 598.58. In plain terms, the short- and medium-term averages are beneath the price, which usually reflects bullish positioning, but the chart has not produced a fresh moving-average crossover to confirm a new regime.
What stands out most is where META sits inside its recent band. The stock is at 100% of the 20-session range, with support at 543.67 and resistance at 653.69, meaning the latest print is effectively pressing against the ceiling of the current range. The 3-month high at 686.08 and low at 524.49 frame the bigger battlefield: META is closer to the upper end of that window, but not yet through it. As shown in the chart, price is also above the Bollinger upper band at 634.75, which often signals an extended move that can continue, but with a higher risk of pause or pullback.
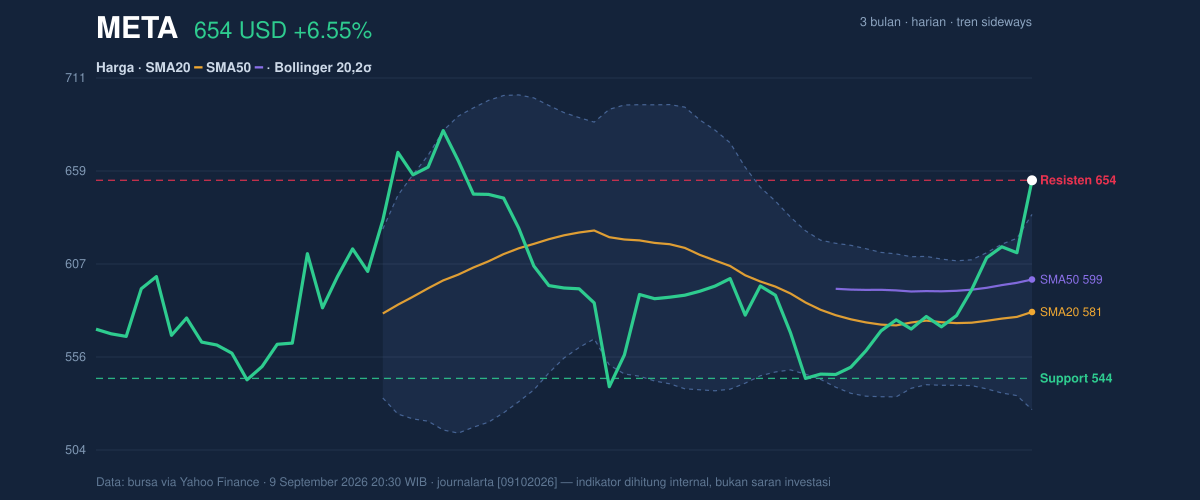
The SMA20 slope of 1.07% over 5 days is another constructive sign. A rising short-term average usually means recent buying has been strong enough to lift the trend line itself, not just the last price. Still, the absence of a new MA-cross keeps this from becoming a fully confirmed breakout story.
Oscillators & Momentum
Momentum is emphatically positive, but it is also flashing caution. The RSI at 70.5 and Stochastic %K at 96.5 / %D at 93.4 both sit in overbought territory, as shown in the chart. For general readers, that does not mean the stock must fall immediately; it means the recent climb has been fast enough that the market may be temporarily crowded on the long side. When both oscillators are this elevated, gains can keep coming, but the stock becomes more vulnerable to a cooling-off period.
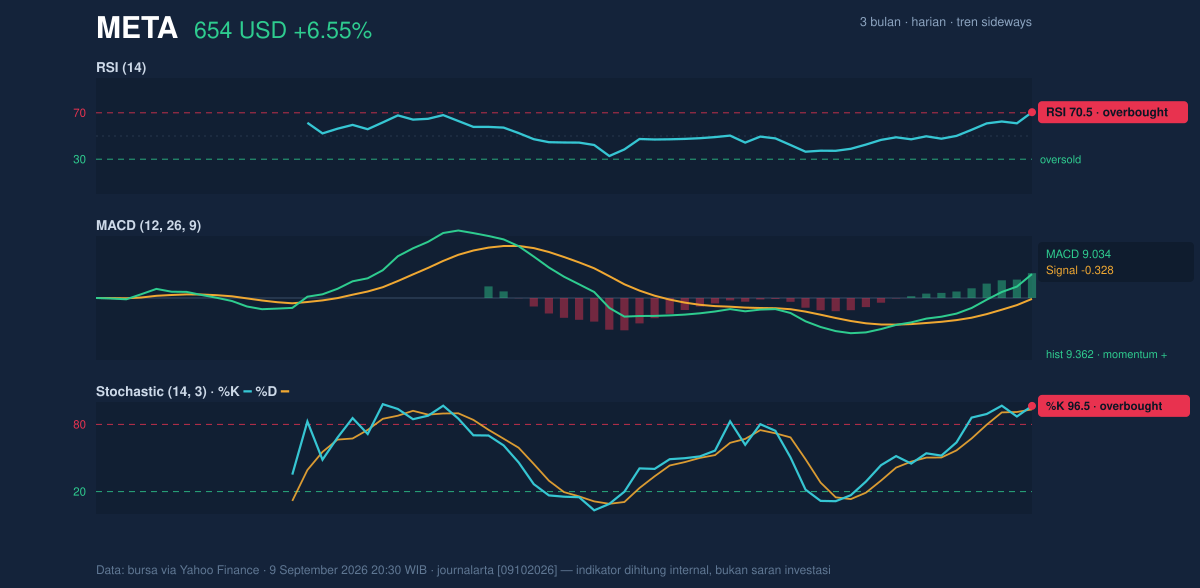
The MACD at 9.034, with a signal line at -0.328 and a histogram of 9.362, tells a different part of the story. MACD is a trend-following tool, and here it is still strongly positive, showing that upward momentum remains intact even as shorter-term oscillators look stretched. That combination — overbought RSI and Stochastic, but a powerful positive MACD — often appears near strong advances that have not yet reversed, though they are increasingly dependent on fresh buying to keep extending.
Volatility & Volume
Volatility is not extreme, but it is active. The ATR(14) at 19.90, or 3.0% of price, indicates a stock that can still move meaningfully in either direction on a normal session. The Bollinger band width of 18.7% is described as normal, which suggests the stock is not in a volatility squeeze, where a very tight band often precedes a sharp expansion. Instead, META appears to be trading in an already-expanded state, with the current price sitting above the upper band.
That matters because the message from price and volume is synchronized. The 2.1x volume jump and OBV rising both support the advance, indicating that accumulation — the steady net buying pressure measured by on-balance volume — is backing the move. In practical terms, this is not a rally that looks hollow on the chart. The market is showing conviction, but conviction at this height can also become fragile if buyers pause.
Key Levels & Scenarios
The most important line in the sand is still the 653.69 resistance, which is also the latest price. A clean hold above this level would keep the stock pressed against the top of its recent structure and leave the 686.08 3-month high as the next visible reference point. If the stock cannot maintain this breakout area, the first meaningful retest zone is likely the 634.75 Bollinger upper band, followed by the 598.58 SMA50 and 580.54 SMA20, both of which now act as layered support.
The deeper support to watch is 543.67. A drop back toward that level would imply the recent rally has faded into range trading again, rather than evolving into a sustained trend. The fact that price is already above the upper band and overbought on both RSI and Stochastic means the market has little margin for error if momentum cools.
Technical Verdict: HOLD (wait & see)
HOLD (wait & see)
- RSI at 70.5 and Stochastic at 96.5 / 93.4 show the stock is overbought, which raises the odds of near-term consolidation.
- MACD remains strongly positive, and OBV is rising, so the uptrend is still supported by momentum and participation.
- Price is above the Bollinger upper band at 634.75 and already at 653.69 resistance, which makes follow-through possible but not yet cleanly confirmed.
Verdict invalidated if price falls below 598.58, the SMA50, because that would weaken the current bullish structure and suggest the breakout attempt is losing force.
- Ideal Entry Range: 634.75 to 653.69
- Exit Target (Target Price): 686.08
- Stop Loss protection: 580.54
For non-traders, this means META is strong, but the chart is stretched enough that the next move needs confirmation rather than assumption.
“It’s a powerful push, but the market now has to prove it can hold the height.”
Summary Data META
| Last price | 653.69 USD |
| Change 1 day / 5 days / 1 month | 6.55% / 12.99% / 9.11% |
| Trend / MA-cross | sideways / none |
| SMA20 / SMA50 | 580.54 / 598.58 |
| RSI (14) / Stochastic %K | 70.5 / 96.5 |
| Bollinger %B / ATR | 117% / 19.90 |
| Support / Resistance 20 days | 543.67 / 653.69 |
| Data as of | 9 September 2026 20:30 WIB |
Track META stock price daily: live levels, support/resistance and our full META analysis history.



