OCBC Momentum Weakens: Stock Drops 1.10% (September 10, 2026)
On September 10, 2026: price 31.35 SGD, trend sideways, RSI 56.4, support 30.78, resistance 32.27. technical analysis of ocbc stock. OCBC Momentum Weakens —…
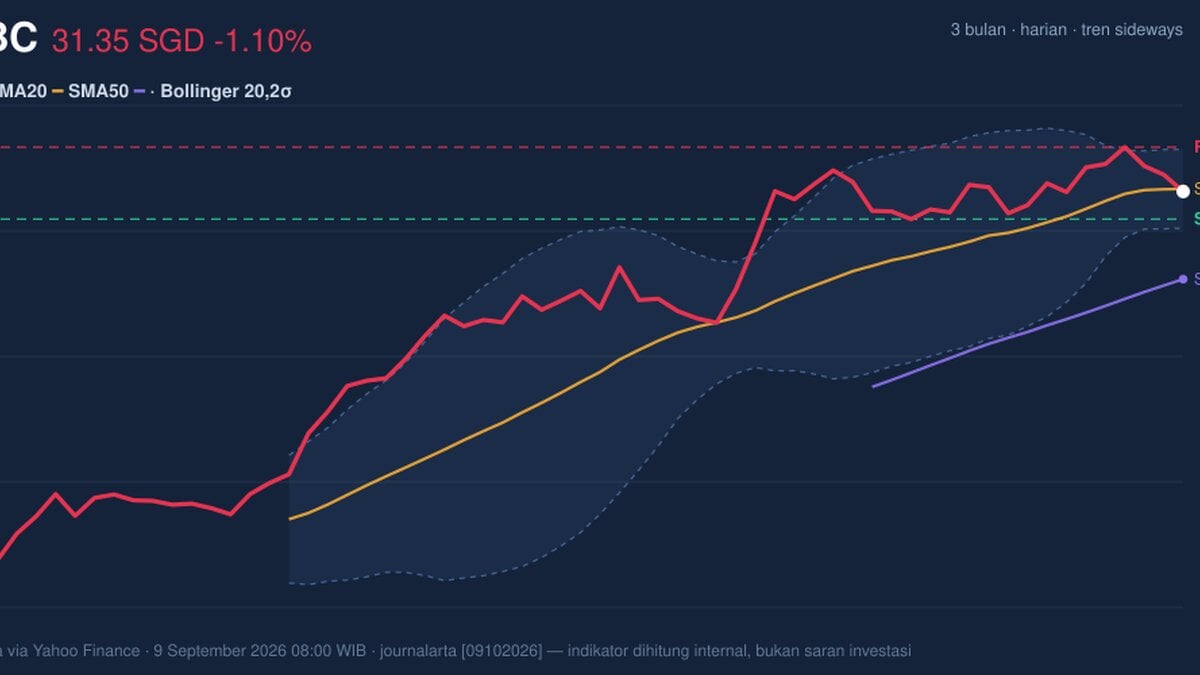
OCBC Bank’s shares on the Singapore Exchange slipped to 31.35 SGD, down 1.10% from the previous close of 31.70, as investors weighed a stock that is still trading in a broad sideways pattern but has not yet convincingly reclaimed its short-term trend line. The move leaves the counter just below its SMA20 at 31.41, which matters because that line is often watched as a quick read on whether recent buying pressure is still intact or fading.
Trend & Price Action
The chart shows a stock that is not in a clean uptrend or downtrend, but in a holding pattern, with the broader trend described as sideways and the SMA20 slope still positive at 1.34% over 5 days. That combination is subtle but important. It suggests the recent drift has not broken the larger short-term structure, even though the latest price is sitting below the SMA20. In practical terms, traders are seeing a market that is still trying to stabilize rather than one that has clearly rolled over.
The longer average remains supportive: SMA50 at 29.54 sits well below the current price. That gap tells readers that the medium-term base is still higher than where the stock is now, so the share price has not lost its broader footing. There is also no fresh MA-cross, which means there is no new moving-average signal to suggest a decisive trend shift. The absence of a crossover often leaves price action to do the talking, and right now that message is mixed rather than emphatic.
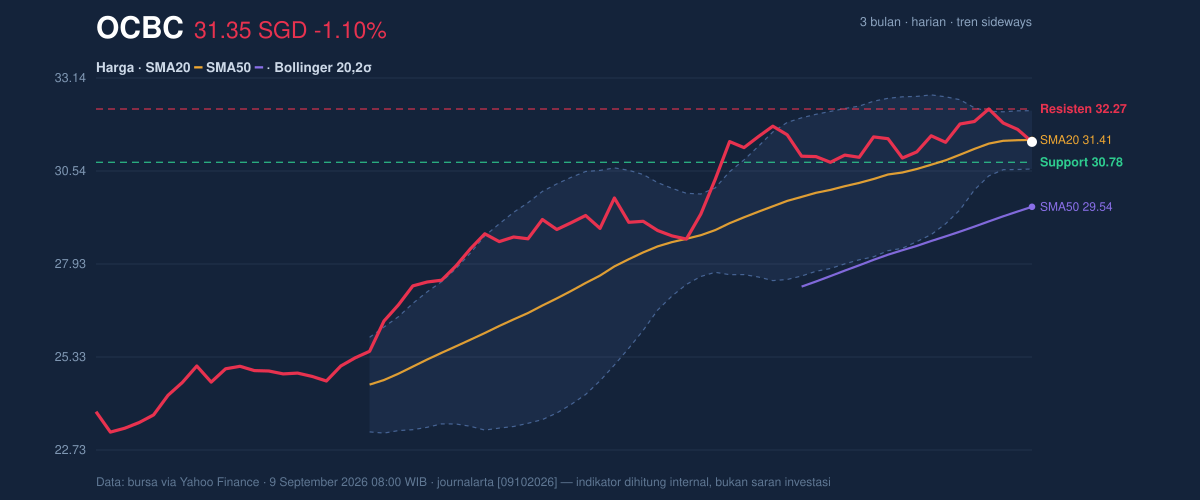
The stock is trading at 38% of its 20-hour range, with support at 30.78 and resistance at 32.27. That positioning is closer to the lower half of the recent band, but not close enough to support to imply immediate breakdown risk. The broader 3-month range is also useful context: 32.57 is the recent high and 23.11 the low. With price still near the upper part of that range, the chart does not show a damaged structure; instead it shows a stock consolidating after a strong prior advance.
Oscillators & Momentum
Momentum indicators are not flashing either a strong breakout or a deep selloff. The RSI at 56.4 is neutral, which usually means the market is neither overbought nor oversold. That is a useful signal in a sideways tape: it implies there is still room for price to move in either direction without immediately running into momentum extremes.
The Stochastic %K at 45.0 and %D at 58.9 also sit in neutral territory. More importantly, %K is below %D, which reflects a softer near-term turn in momentum. This does not amount to a collapse, but it does suggest the latest bounce has lost some speed. When stochastic sits in the middle of its range rather than near the extremes, the market is usually waiting for a catalyst rather than already committing to one direction.
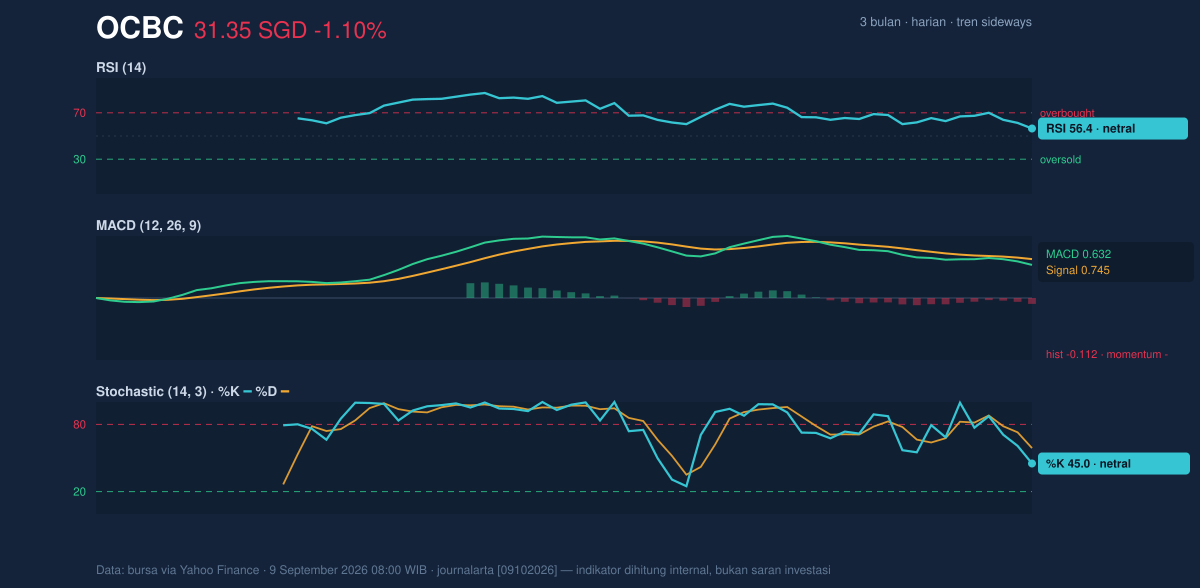
The clearest caution comes from the MACD at 0.632, which remains positive in absolute terms but is still below the signal line at 0.745, leaving the histogram at -0.112. That negative histogram matters more than the headline MACD value. It means upside momentum is still present in a broad sense, but it is weakening relative to its trigger line. In plain language, the stock is not losing its trend outright, but its pace has slowed enough to keep traders alert for either a pause or a deeper retest.
Volatility & Volume
Volatility is moderate. ATR(14) at 0.51, equal to 1.6% of price, indicates the stock typically moves enough in a day to matter, but not so violently that the chart is unstable. That is consistent with a name that is consolidating rather than breaking down. The Bollinger Bands reinforce that reading: the band width is only 5.2%, and the setup is described as a squeeze, which often precedes a larger move once price escapes the narrow range.
The current price is near the middle of the band structure, with %B at 47%, meaning it is slightly below the midpoint between the upper and lower bands. That is not a breakout posture. It is a waiting posture. But squeezes are important because they compress energy; the next directional move can be sharper than recent trading has suggested. The chart is therefore less about what has happened than what may happen once the range gives way.
Volume adds a constructive note. Last trading volume was 6,159,000, above the 20-hour average of 5,780,679, or 1.1× normal. That is not a surge, but it does show participation rather than apathy. More tellingly, OBV is rising, which indicates that net volume flow has been supportive even while price has softened. When OBV rises while price stalls, it can mean accumulation is still present beneath the surface, though not yet strong enough to force a breakout.
Key Levels & Scenarios
The nearby map remains straightforward. A move back above 31.41 would put the stock back over the short-term average and suggest the latest dip is being absorbed. A push through 32.27 would matter more, because that is the immediate resistance and the upper edge of the recent trading band. If that ceiling gives way, the squeeze in Bollinger Bands could resolve into a stronger directional move.
On the downside, 30.78 is the key level to watch. A break below that support would expose the lower Bollinger band at 30.59, and that would signal the market is no longer merely consolidating but beginning to lose its short-term base. Because the stock is still above the SMA50 at 29.54, a failure under 30.78 would not automatically damage the medium-term structure, but it would weaken the current setup materially.
Technical Verdict: HOLD (wait & see)
HOLD (wait & see) because the chart is mixed: price is below the SMA20, MACD histogram is negative, and momentum has softened, yet OBV is rising and the stock remains above the SMA50. The Bollinger squeeze also argues that the next meaningful move may still be ahead, not behind. The verdict is invalidated if price breaks below 30.78, as that would weaken the support base and shift the setup from consolidation to deterioration.
- Ideal Entry Range: 30.78 to 31.41
- Exit Target: 32.27, with the next reference at 32.57
- Stop Loss protection: below 30.59, with 30.78 as the nearer warning line
In plain English, the chart says OCBC is not broken, but it is still waiting for a clearer signal before the next move is confirmed.
The next market cue will come from whether the share price can reclaim 31.41 and challenge 32.27, or whether it slips back toward 30.78 after the current squeeze.
Summary Data OCBC
| Last price | 31.35 SGD |
| Change 1 day / 5 days / 1 month | -1.10% / -1.57% / 0.51% |
| Trend / MA-cross | sideways / none |
| SMA20 / SMA50 | 31.41 / 29.54 |
| RSI (14) / Stochastic %K | 56.4 / 45.0 |
| Bollinger %B / ATR | 47% / 0.51 |
| Support / Resistance 20 days | 30.78 / 32.27 |
| Data as of | 9 September 2026 08:00 WIB |
Track OCBC share price daily: live levels, support/resistance and our full OCBC analysis history.



