Singtel Stock Gains 0.44%, Golden Cross Formed In Focus
On September 10, 2026: price 4.56 SGD, trend uptrend, RSI 59.9, support 4.25, resistance 4.56. technical analysis of singtel stock. Singtel Stock Gains — full…
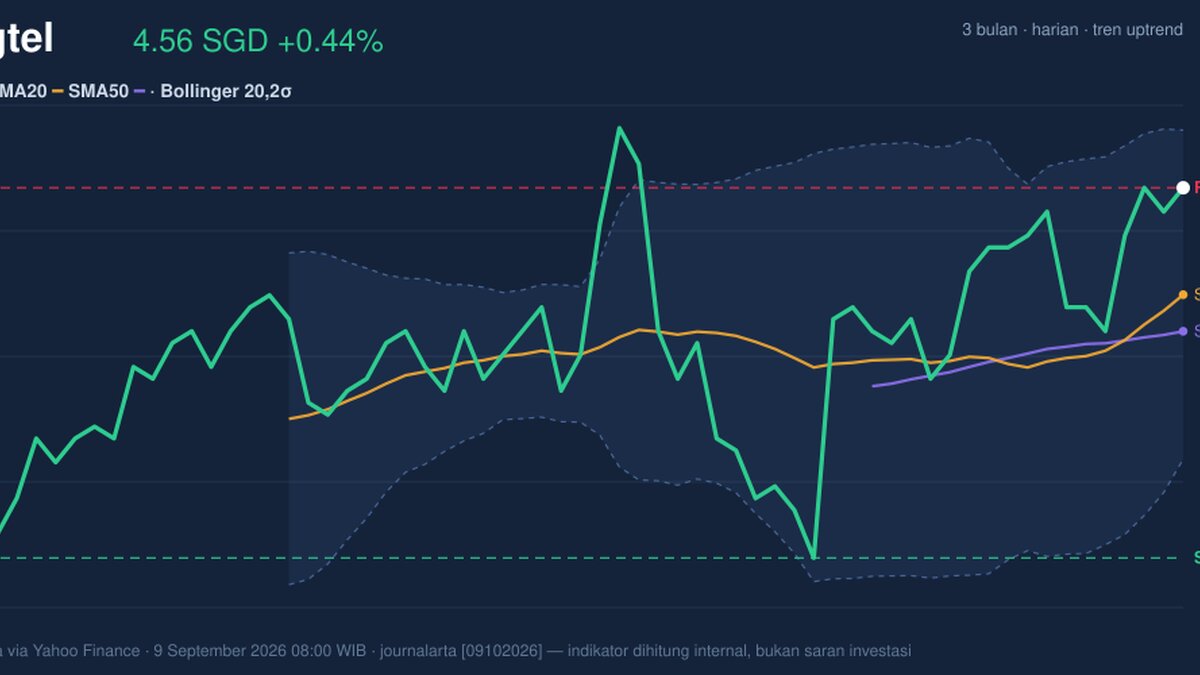
Singapore Telecom’s Singtel edged up to SGD 4.56 on SGX, extending a one-month rise of 6.29% as the shares sit above both short- and medium-term moving averages, a setup that signals improving trend strength in Singapore’s largest telecom name. The move is not dramatic, but it matters: the stock is now trading at the top of its recent range, and that often tells traders the market is willing to pay up for stability, cash flow visibility, or simply a cleaner technical picture.
Trend & Price Action
The broader message from the chart is constructive. Singtel is in an uptrend, with the SMA20 at 4.47 above the SMA50 at 4.44, and the recent golden cross — where the 20-day average moves above the 50-day average — is a classic sign that short-term buying has started to outrun the slower trend. In plain English, that crossover usually means the market has shifted from hesitation to accumulation, even if the move is still measured rather than explosive.
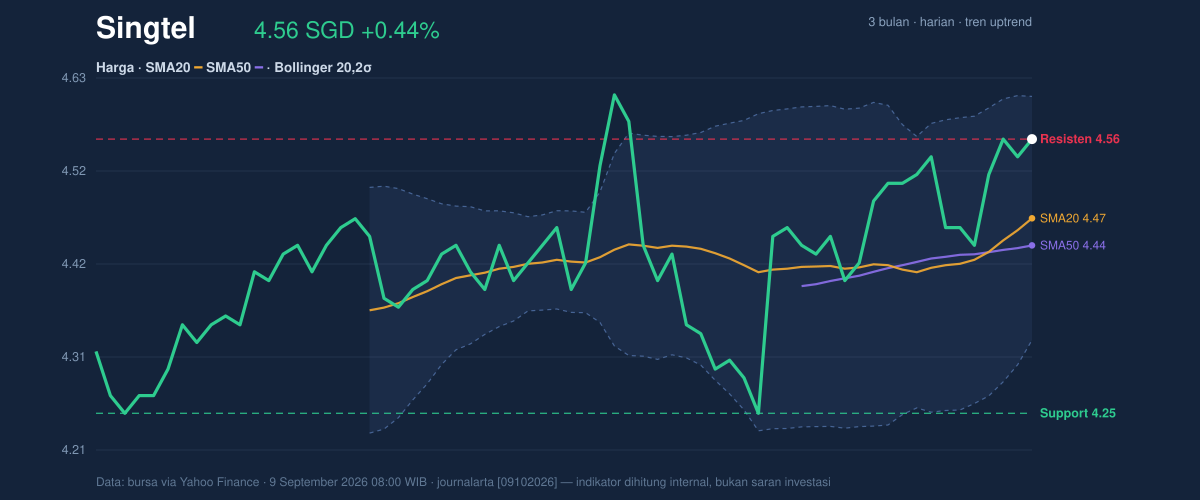
Price is also holding above the SMA20, which matters because that average is acting like a short-term floor. The stock’s 1-day gain of 0.44% and 5-day gain of 2.24% show steady follow-through, not a one-session spike that fades quickly. With the shares now at 100% of the 20-hour range, they are pressing into the upper edge of the recent band, where momentum traders often watch for either continuation or a pause.
The wider context is still relevant. Singtel remains below its 3-month high of 4.70, but above the 3-month low of 4.15, so the stock is trading in the upper half of its recent range without yet breaking into new territory. That positioning suggests the market has recovered from weakness, but it has not yet proven a full trend extension.
Oscillators & Momentum
The momentum signals are mixed, and that is the key nuance in this setup. The RSI at 59.9 is neutral, which means the stock is neither stretched nor washed out. That is important because it leaves room for further upside without immediately flashing an overbought warning.
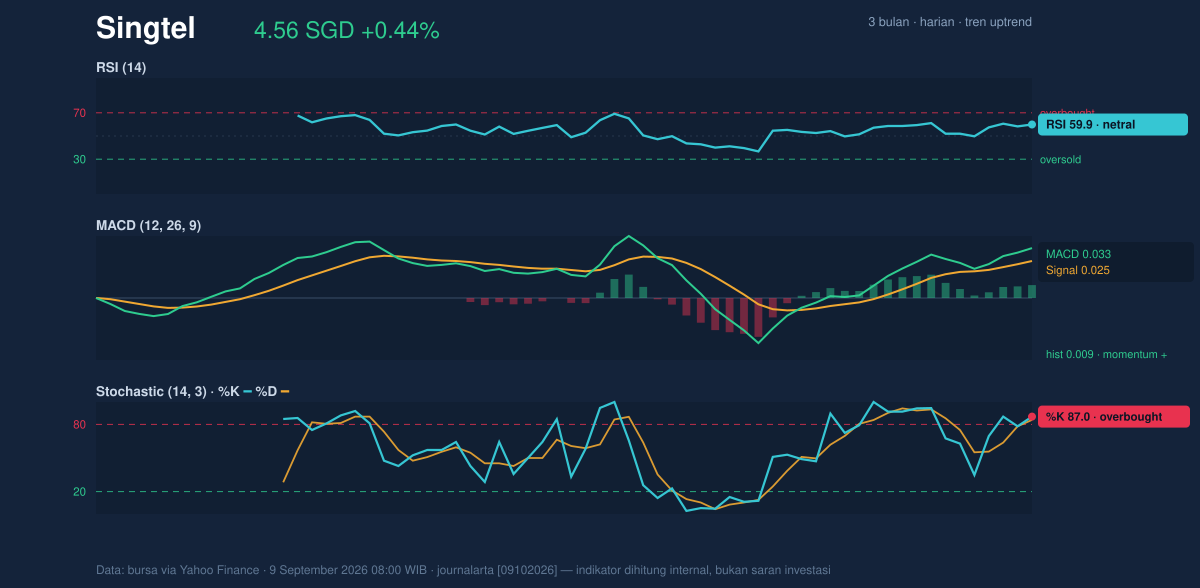
By contrast, the Stochastic %K at 87.0 and %D at 84.1 are in overbought territory. For general readers, that does not automatically mean the shares must fall; it means the recent advance has been fast enough that the stock may be vulnerable to a short pause or a mild pullback. In other words, price has climbed ahead of its own comfort zone.
The MACD at 0.033, above the signal line at 0.025, still supports the uptrend. MACD is a trend-following gauge, and when it stays above its signal line, it usually indicates buying pressure remains intact. The histogram at 0.009 is positive, which confirms that upward momentum is still present, even if it is not accelerating sharply.
That combination — neutral RSI, overbought Stochastic, positive MACD — often describes a market that is trending but getting a little crowded in the short term. It is not a breakdown signal. It is a reminder that momentum can continue, but it may do so with interruptions.
Volatility & Volume
Volatility is moderate, not wild. The ATR(14) at 0.07, equal to 1.6% of price, suggests typical daily movement remains contained. That matters because a stock can be technically strong without being volatile; in Singtel’s case, the chart is pointing to gradual rather than disorderly price action.
The Bollinger Bands add another useful clue. Price is near the upper band at 4.61, with the middle band at 4.47 and the lower band at 4.33. The %B at 82% shows the shares are trading in the upper portion of the band structure, which usually reflects strength, but also leaves less room before the price bumps into short-term resistance. More importantly, the band width is just 6.2% and is narrowing, a squeeze pattern that often precedes a larger move. A squeeze does not predict direction on its own; it simply says the market has been compressing energy and may soon release it.
Volume does not yet confirm a breakout. Last session turnover was 17,446,200, below the 20-session average of 23,138,425, or about 0.8x normal. That means the latest rise has happened on lighter participation, which tempers the strength of the signal. Still, OBV is rising, and that matters because on-balance volume tracks whether money flow is broadly supporting the trend. In simple terms, the price is rising, and the cumulative volume line is still climbing with it.
Key Levels & Scenarios
The market is now leaning on a narrow set of levels. Immediate support sits at 4.25, while the nearest resistance is 4.56, which is also the latest price. That makes the current area a decision point rather than a comfortable cruising zone.
If the stock can hold above the SMA20 at 4.47 and push through the upper Bollinger band at 4.61, the chart would begin to suggest a more decisive continuation phase. If it fails to hold the 4.47 area, the market may drift back toward the 4.33 lower band, where buyers would likely need to reassert control. A drop through 4.25 would weaken the current structure more visibly, because that level marks the lower edge of the recent 20-hour range.
Technical Verdict: HOLD (wait & see)
HOLD (wait & see) fits best because the trend is improving, but momentum is not fully clean at the current price level.
- Reason 1: The trend is positive, with a golden cross and price above the SMA20 at 4.47 and SMA50 at 4.44.
- Reason 2: MACD is positive and the histogram remains above zero, so the broader directional bias is still upward.
- Reason 3: Stochastic is overbought and price is near the upper Bollinger band at 4.61, which raises the chance of a pause before any further advance.
- Invalidation: The verdict is invalidated if price falls below 4.25, because that would break the stated 20-hour support.
- Ideal Entry Range: 4.47 to 4.33
- Exit Target: 4.61 to 4.70
- Stop Loss Protection: below 4.25
In plain English, Singtel’s chart is still constructive, but it is close enough to resistance that patience matters more than chasing the move.
Summary Data Singtel
| Last price | 4.56 SGD |
| Change 1 day / 5 days / 1 month | 0.44% / 2.24% / 6.29% |
| Trend / MA-cross | uptrend / golden |
| SMA20 / SMA50 | 4.47 / 4.44 |
| RSI (14) / Stochastic %K | 59.9 / 87.0 |
| Bollinger %B / ATR | 82% / 0.07 |
| Support / Resistance 20 days | 4.25 / 4.56 |
| Data as of | 9 September 2026 08:00 WIB |
Track Singtel share price daily: live levels, support/resistance and our full Singtel analysis history.



