XOM Stock Gains 2.22%, Testing Key Resistance In Focus
On September 10, 2026: price 164.23 USD, trend uptrend, RSI 58.6, support 156.44, resistance 166.15. technical analysis of xom stock. XOM Stock Gains — full…
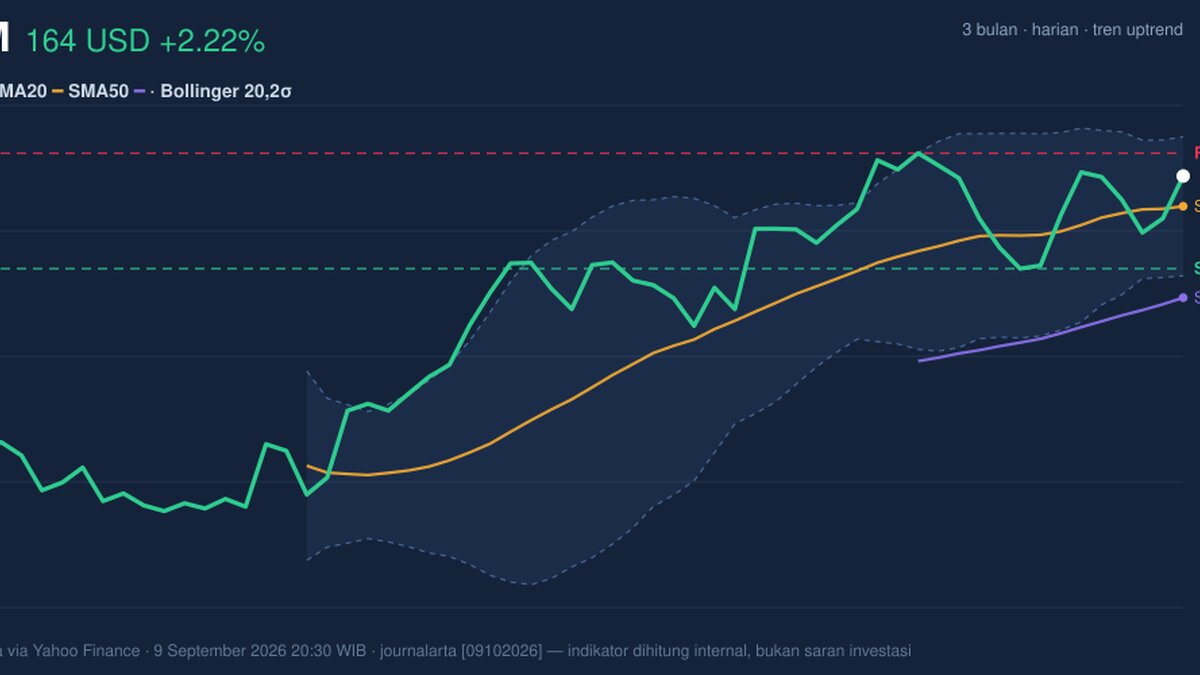
ExxonMobil’s shares on the NYSE rose to 164.23 USD on 9 September 2026, up 2.22% from the previous close of 160.66, but the chart still shows a market that is advancing more by structure than by conviction. The stock is sitting above its short- and medium-term averages, yet the momentum picture is less decisive than the price action suggests, which is why the move reads as constructive rather than fully confirmed.
Trend & Price Action
XOM remains in an uptrend, and the most important signal is that price is holding above the SMA20 at 161.69 and well above the SMA50 at 154.01. That matters because a stock above both averages usually means the market is still rewarding recent buyers and treating dips as temporary rather than structural damage. The SMA20 slope of 0.99% over 5 days suggests the near-term trend is still rising, but there has been no new MA-cross, so this is not a fresh acceleration phase.
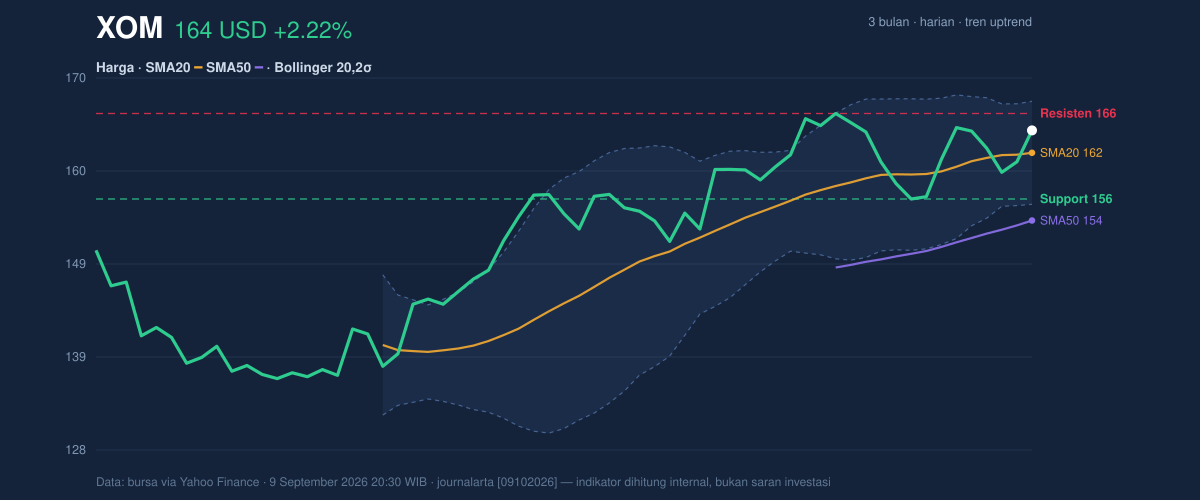
The Bollinger Bands add another layer. With the upper band at 167.53, the middle band at 161.69, and the lower band at 155.85, the stock is trading in the upper half of its recent range, with %B at 72%. In plain English, that means price is leaning toward the stronger side of the band but has not yet pushed into the kind of stretched territory that often precedes a pullback. The key nuance is the 7.2% band width, which is narrowing; a squeeze like this often signals that the market is coiling for a sharper move, though the direction still needs confirmation.
XOM is also near the top of its recent range. The stock is at 80% of the 20-day range, with support at 156.44 and resistance at 166.15. That positioning says buyers have regained control from the mid-range, but the price has not yet proven it can clear the ceiling. The 3-month high of 168.64 sits just above current resistance, which makes the next test important: a clean break would put the stock back into discovery mode for the recent range, while failure there would reinforce the idea of a capped rally.
Oscillators & Momentum
The momentum signals are more mixed than the trend. The RSI at 58.6 is neutral, which is a healthy place for an uptrend because it is neither overbought nor weak enough to imply exhaustion. The Stochastic %K at 66.9 and %D at 46.0 also point to a market with room to move, but not one that is already overheated. That combination supports the idea that the recent advance can continue, though it does not yet scream urgency.
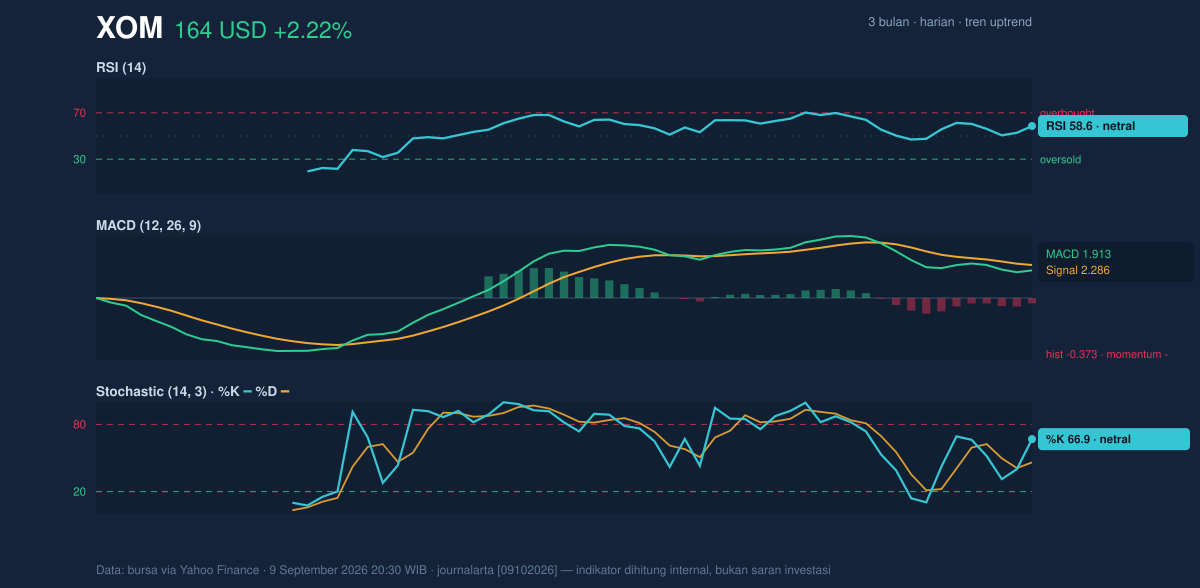
The caution comes from the MACD at 1.913 versus the signal line at 2.286, with a histogram of -0.373. In practical terms, that means the faster trend measure has slipped below its smoother signal line, a sign that upside momentum has softened even while price remains elevated. This is often what a mature rally looks like: price stays firm, but the internal push behind it cools before the next leg. The signal does not mean the trend has reversed; it means the market is asking for proof before extending higher.
Volatility & Volume
Volatility is moderate, with ATR(14) at 3.41, equal to 2.1% of price. That suggests daily swings are present but not extreme, which is consistent with a large-cap energy name moving inside a tightening band. The important point is that a squeeze in Bollinger width combined with moderate ATR often precedes a more directional move, not a quiet drift.
Volume, however, is not confirming the advance with much enthusiasm. The latest reading of 13,124,000 shares is only about 1.0× normal versus the 20-day average of 13,657,165. That means the rally is not being powered by unusual participation, and the OBV is falling, which is a subtle warning that volume flow has not fully supported the price recovery. When price rises while OBV slips, it can indicate that buyers are present, but not yet decisive enough to create strong accumulation.
Key Levels & Scenarios
The immediate map is clear. Resistance at 166.15 is the first barrier, followed by the upper Bollinger band at 167.53 and then the 3-month high at 168.64. On the downside, support at 156.44 is the main line to watch, with the SMA20 at 161.69 acting as the near-term trend floor. Because the stock is already near the top of its 20-day range, the next move matters more than the current level.
If XOM clears 166.15 and then holds above 167.53, the chart would suggest the squeeze is releasing to the upside, with the recent high at 168.64 becoming the next reference point. If it fails to hold 161.69, the price could rotate back toward 156.44, where the market would be tested on whether the broader uptrend is still intact.
Technical Verdict: HOLD (wait & see)
The chart is constructive, but not yet fully confirmed. The stock is above the SMA20 and SMA50, which supports the trend, while the Bollinger squeeze hints at a possible breakout. At the same time, MACD is negative versus its signal line and OBV is declining, which says the move lacks strong internal confirmation. The verdict is invalidated if price breaks below 156.44, because that would weaken the current range structure and challenge the uptrend.
- Ideal Entry Range: 161.69 to 166.15
- Exit Target (Target Price): 167.53 to 168.64
- Stop Loss Protection: 156.44
In plain English: the stock still looks firm, but the chart wants a cleaner break or a better pullback before the next move is trusted. The next scheduled reference point is the market’s reaction around 166.15 and the 3-month high at 168.64.
Summary Data XOM
| Last price | 164.23 USD |
| Change 1 day / 5 days / 1 month | 2.22% / -0.19% / 2.77% |
| Trend / MA-cross | uptrend / none |
| SMA20 / SMA50 | 161.69 / 154.01 |
| RSI (14) / Stochastic %K | 58.6 / 66.9 |
| Bollinger %B / ATR | 72% / 3.41 |
| Support / Resistance 20 days | 156.44 / 166.15 |
| Data as of | 9 September 2026 20:30 WIB |
Track XOM stock price daily: live levels, support/resistance and our full XOM analysis history.



