Golden Cross Formed, Singtel Stock Drops 0.88% Today
On September 11, 2026: price 4.52 SGD, trend uptrend, RSI 55.3, support 4.40, resistance 4.56. technical analysis of singtel stock. Golden Cross Formed — full…
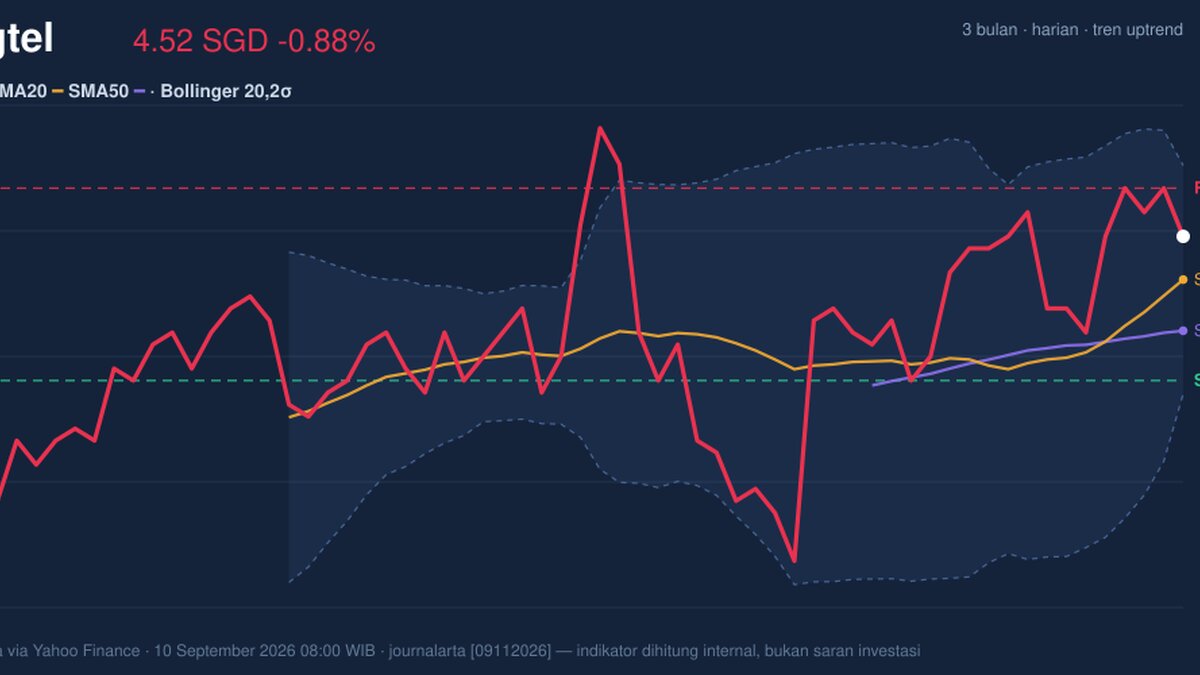
Singapore Telecom (Singtel) slipped to SGD 4.52 on SGX by 10 September 2026 08:00 WIB, down 0.88% from the previous close, even as the broader technical picture still points to an upward bias. The share is trading above its short- and medium-term averages, and that matters because it suggests sellers have not yet taken back control. But the move is not one-way: momentum is positive, volume is lighter than usual, and the stock is sitting in the upper half of its recent range, where traders often watch for either a continuation or a pause.
Trend & Price Action
The clearest signal is the trend structure. Singtel is above SMA20 at SGD 4.48 and SMA50 at SGD 4.44, while the chart shows a golden cross — the shorter average has moved above the longer one. In plain terms, that is a classic sign that the recent price trend has improved relative to the longer baseline. The SMA20 slope of 1.37% over 5 days reinforces that the short-term trend is still rising rather than flattening out.
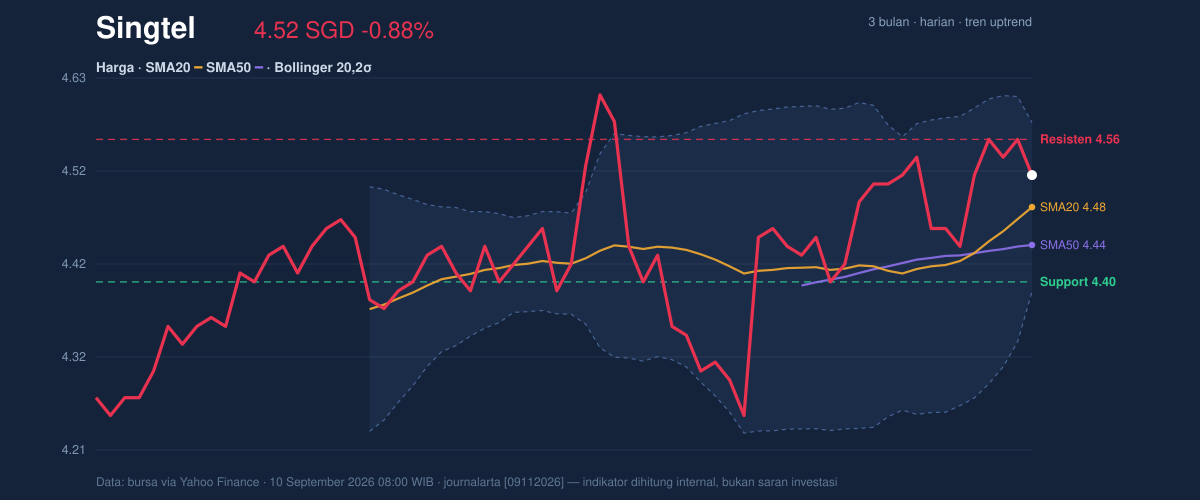
The stock is also trading in the upper part of its recent band, with support at SGD 4.40 and resistance at SGD 4.56. Being at roughly 75% of the range tells you the price is not stretched to the top, but it is close enough that buyers may need fresh momentum to push through. The 3-month high of SGD 4.70 and 3-month low of SGD 4.19 frame the bigger battleground: the current price sits well above the low, but still below the prior peak, so the market is in recovery mode rather than in a full breakout.
Oscillators & Momentum
The momentum gauges are more balanced than the trend tools. RSI at 55.3 is neutral, which means the stock is neither overbought nor oversold. That is important because it suggests the recent rise has room to continue without immediately looking overheated. At the same time, neutrality also means there is no strong momentum burst behind the move yet.
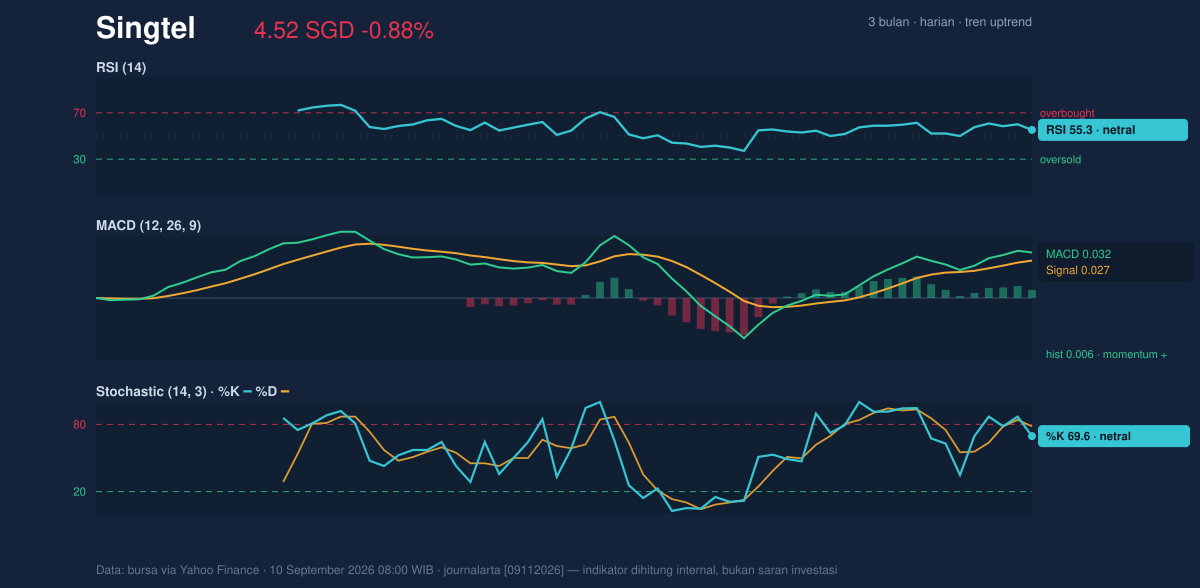
The Stochastic reading of 69.6 / 78.3 is also neutral, though it leans closer to the upper end of the scale. That usually signals a stock that has recovered, but not one that has clearly broken into a strong impulsive phase. The more encouraging reading is the MACD at 0.032 versus signal at 0.027, with a positive histogram of 0.006. In simple terms, MACD is showing that short-term price momentum still sits slightly above the slower trend line, which supports the idea that the uptrend is intact even if it is not accelerating sharply.
Volatility & Volume
The Bollinger setup is especially useful here. Price is near the middle-to-upper part of the band, with the upper band at SGD 4.58, middle at SGD 4.48, and lower at SGD 4.39. The %B at 69% means the price is closer to the upper band than the lower one, which is consistent with a constructive tone. More importantly, the 4.2% band width shows the bands are narrowing. That is the market’s way of saying volatility has compressed, and compressed volatility often precedes a larger move. The direction of that move is not guaranteed, but the setup tends to reward whichever side wins the next decisive test.
Volatility itself is moderate, with ATR(14) at 0.07, or 1.6% of price. That suggests the stock is not swinging wildly day to day. Meanwhile, volume came in at 13,947,814, below the 20-day average of 20,764,823, or about 0.7× normal. Lower turnover during an uptrend can mean the market is pausing rather than rejecting the move, but it also means the latest rise has not yet been strongly confirmed by broad participation. The one constructive counterweight is that OBV is rising, which indicates cumulative buying pressure has still been building even if the latest session was quieter.
Key Levels & Scenarios
The immediate line in the sand is SGD 4.56 resistance. A move through that level would matter because it would clear the top of the recent range and bring the market closer to the 3-month high at SGD 4.70. On the downside, SGD 4.40 support is the first level that needs to hold to keep the short-term structure intact. Below that, the next reference is the SMA20 at SGD 4.48, which now acts as a trend checkpoint rather than a ceiling.
If price can hold above SGD 4.48 and then reclaim SGD 4.56, the chart would be signaling continuation rather than consolidation. If it loses SGD 4.40, the message changes quickly: the recent breakout attempt would look weaker, and the market would likely revisit the lower part of the range.
Technical Verdict: HOLD (wait & see)
HOLD (wait & see) fits best because the trend is constructive, but momentum is still only moderate and volume confirmation is soft.
- Golden cross and price above SMA20/SMA50 support the trend.
- MACD is positive, but RSI 55.3 and Stochastic 69.6 / 78.3 show only neutral momentum, not a strong breakout.
- Bollinger bands are squeezing, which often precedes expansion, but the direction has not yet been confirmed by stronger volume.
- Invalidation: the verdict weakens if price falls below SGD 4.40.
- Ideal Entry Range: SGD 4.48 to SGD 4.52
- Exit Target: SGD 4.56, then SGD 4.58
- Stop Loss protection: below SGD 4.40
In plain English, Singtel’s chart still leans upward, but the market is waiting for proof that the next move has enough force behind it.
Summary Data Singtel
| Last price | 4.52 SGD |
| Change 1 day / 5 days / 1 month | -0.88% / 1.80% / 6.35% |
| Trend / MA-cross | uptrend / golden |
| SMA20 / SMA50 | 4.48 / 4.44 |
| RSI (14) / Stochastic %K | 55.3 / 69.6 |
| Bollinger %B / ATR | 69% / 0.07 |
| Support / Resistance 20 days | 4.40 / 4.56 |
| Data as of | 10 September 2026 08:00 WIB |
Track Singtel share price daily: live levels, support/resistance and our full Singtel analysis history.