Momentum Gains, AIA Stock Drops 2.14% Today
On September 11, 2026: price 75.30 HKD, trend sideways, RSI 49.1, support 70.40, resistance 77.50. technical analysis of aia stock. Momentum Gains — full…
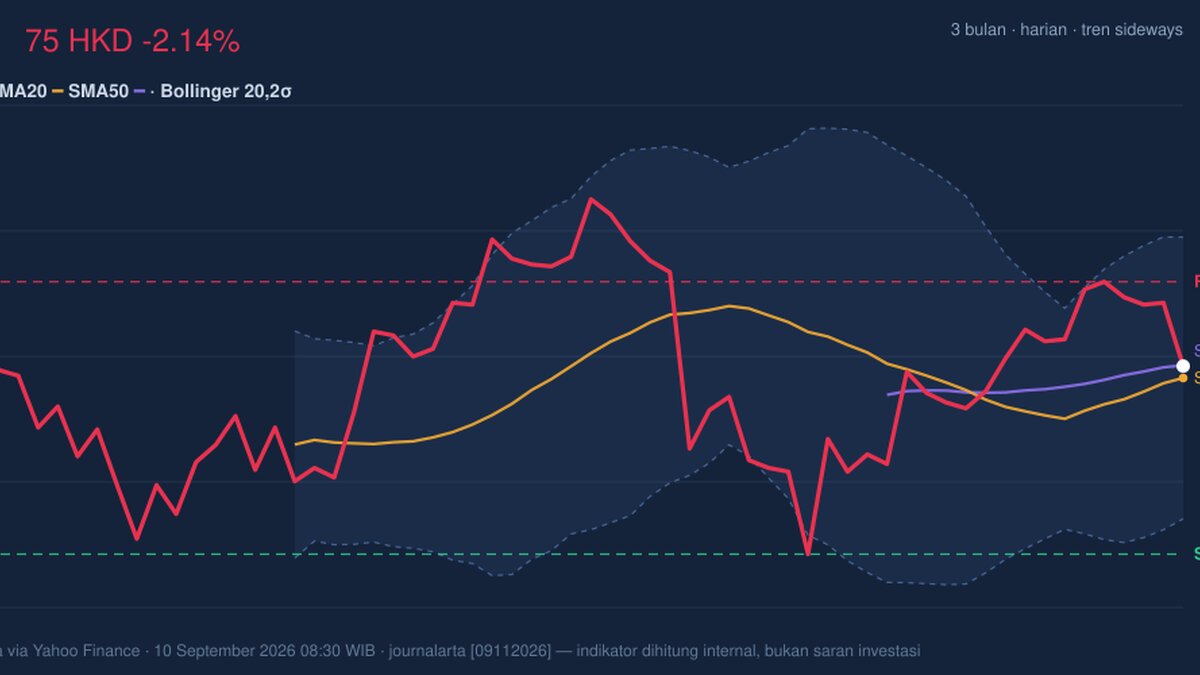
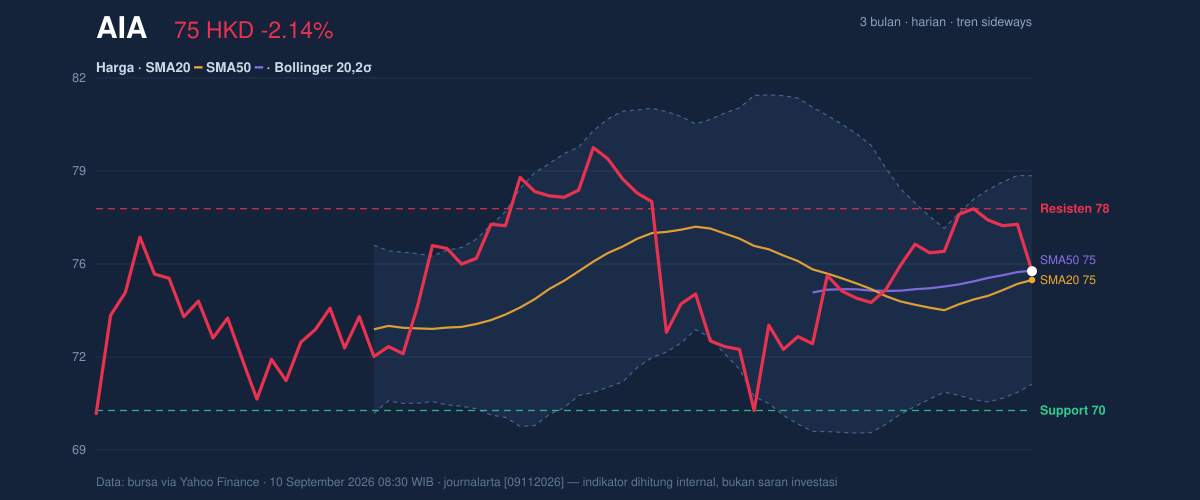
AIA Group slipped to HKD 75.30, down 2.14% on the day and 2.59% over five days, but the broader tape is less fragile than that short-term weakness suggests. The shares are still trading above SMA20 at 74.99 and just under SMA50 at 75.32, which puts the stock right on top of a technical fault line rather than in a decisive trend. As shown in the chart, that positioning matters: price is sitting near the middle of its recent range, not pressed against a breakdown zone, while the one-month gain of 3.79% says the pullback has not erased the recent recovery.
Trend & Price Action
The chart shows a market that is neither trending strongly nor rolling over cleanly. The stated trend is sideways, and the SMA20 slope of 1.15% over five days points to a mild upward tilt, meaning the short-term base is still inching higher even as the latest session weakened. That is usually the signature of consolidation rather than distribution: sellers have not yet forced the price below the short average, but buyers also have not been able to push decisively through the longer one.
Price at HKD 75.30 also sits between the Bollinger midline at 74.99 and the upper band at 78.66, which is a technical way of saying the stock is not stretched. The range placement is important. At 69% of the 20-hour support-resistance band, AIA is leaning toward the upper half of its recent trading corridor, but it is not near the ceiling. The 3-month high at 80.15 and low at 69.05 frame the current move as a recovery that still has room above, provided the stock can hold its footing.
Oscillators & Momentum
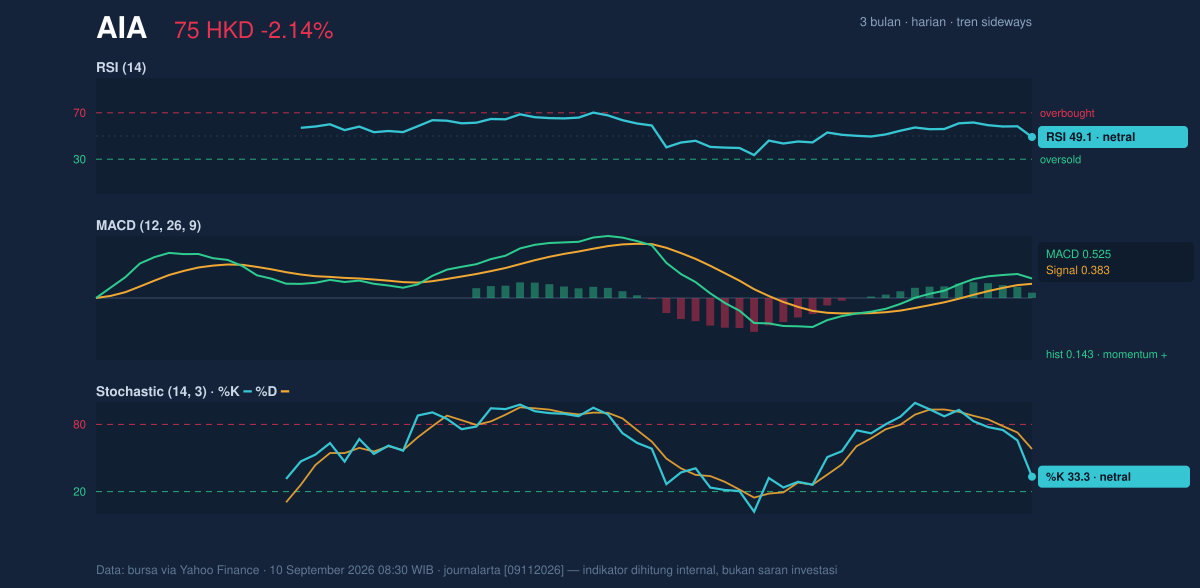
Momentum is more constructive than the latest price change suggests. The MACD at 0.525 sits above its signal line at 0.383, with a positive histogram of 0.143. In plain terms, that means the short-term trend is still carrying more force than the slower trend, even though the stock has paused. This is not a breakout signal on its own, but it does argue against reading the recent decline as a confirmed reversal.
At the same time, the oscillators are not shouting overbought or oversold. RSI at 49.1 is almost dead center, which usually signals balance between buying and selling pressure. The Stochastic %K at 33.3 and %D at 58.0 show that near-term momentum has cooled faster than the broader oscillator, a mild warning that upside enthusiasm has faded for now. But because neither measure is in an extreme zone, the signal is more “pause” than “panic.”
That combination — neutral RSI, softer Stochastic, but positive MACD — is what a sideways market often looks like when it is trying to decide whether to continue consolidating or turn higher. As shown in the chart, the momentum stack is mixed rather than bearish.
Volatility & Volume
Volatility is present, but not disorderly. ATR(14) at 1.54, equal to 2.0% of price, indicates moderate daily movement. That matters because it suggests the stock can still travel enough to test nearby levels, but not with the kind of swinginess that usually accompanies a major trend break. The Bollinger band width of 9.8% is also described as normal, which means there is no squeeze signalling an imminent explosive move, nor an expansion warning of panic.
Volume gives the current move some credibility. The latest turnover of 30,998,228 shares is above the 20-hour average of 28,021,831, or about 1.1x normal. That is not a dramatic surge, but it does show participation on the down day instead of an empty drift lower. More importantly, OBV is rising, and that is a useful counterweight to the daily price dip. On-balance volume tracks whether volume is accumulating on up days or down days; a rising line while price pauses often suggests underlying demand is still present.
Key Levels & Scenarios
The nearest technical floor is the 20-hour support at HKD 70.40. That level sits above the 3-month low of 69.05, so a failure there would expose the lower end of the recent range quickly. On the upside, HKD 77.50 is the first resistance to watch. It is close enough to the current price that any rebound can meet it soon, and the upper Bollinger band at 78.66 sits just above that, reinforcing the area as a near-term ceiling.
The key signal is conditional. If price can reclaim and hold above HKD 75.32, the SMA50 would stop acting as overhead friction and the chart would look more balanced. If it fails to hold HKD 74.99, the Bollinger midline and SMA20, the stock could drift back toward HKD 70.40. The chart is therefore less about a dramatic trend call and more about whether the current base survives another test.
Technical Verdict: HOLD (wait & see)
HOLD (wait & see) because the chart is mixed: MACD remains positive, OBV is rising, and price is still above SMA20 at 74.99, but RSI is neutral and price is sitting just below SMA50 at 75.32, which limits conviction. The Bollinger setup is normal, so there is no volatility breakout signal to force a directional call. This verdict is invalidated if price falls below HKD 70.40, where the nearest support would give way.
- Ideal Entry Range: HKD 74.99 to HKD 75.32
- Exit Target: HKD 77.50 to HKD 78.66
- Stop Loss protection: HKD 70.40
For non-traders, this means AIA’s chart is stable enough to watch, but not strong enough yet to call a clear direction.
Summary Data AIA
| Last price | 75.30 HKD |
| Change 1 day / 5 days / 1 month | -2.14% / -2.59% / 3.79% |
| Trend / MA-cross | sideways / none |
| SMA20 / SMA50 | 74.99 / 75.32 |
| RSI (14) / Stochastic %K | 49.1 / 33.3 |
| Bollinger %B / ATR | 54% / 1.54 |
| Support / Resistance 20 days | 70.40 / 77.50 |
| Data as of | 10 September 2026 08:30 WIB |
Track AIA share price daily: live levels, support/resistance and our full AIA analysis history.