Tencent Stock Drops 1.94% Today, Testing Support Level
On September 11, 2026: price 425.60 HKD, trend downtrend, RSI 37.3, support 425.60, resistance 457.00. technical analysis of tencent stock.
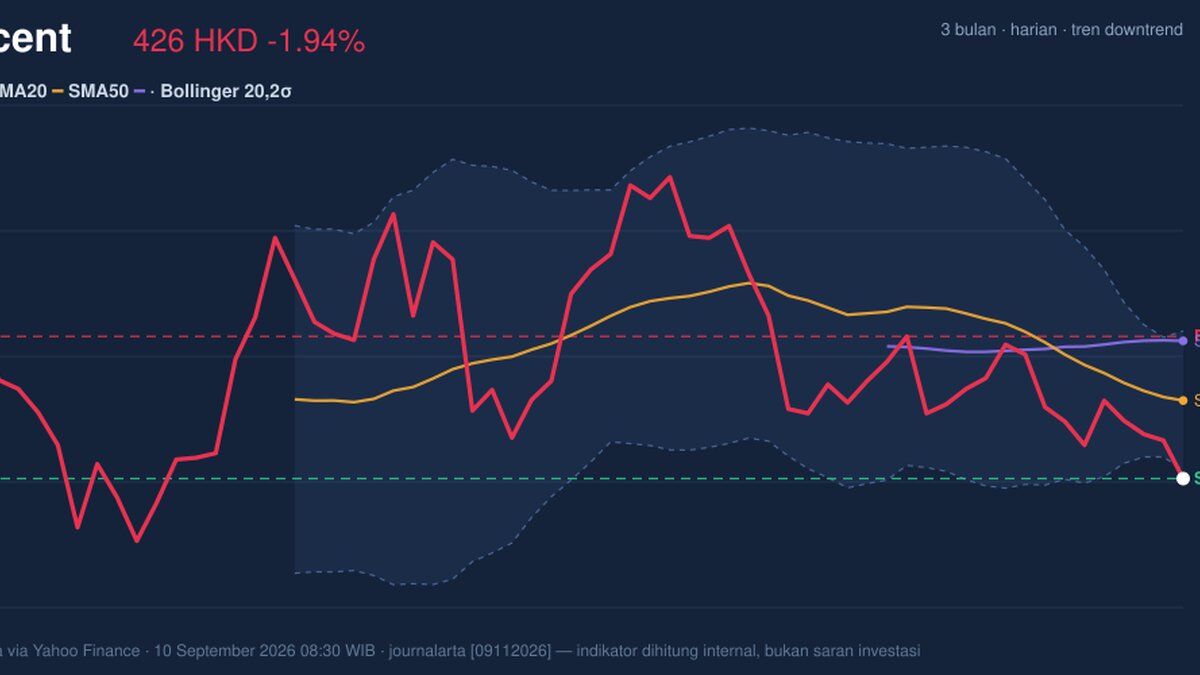
Tencent Holdings slipped on the Hong Kong exchange on 10 September 2026, with 0700.HK last trading at HKD 425.60, down from a previous close of 434.00 as the stock extended a short-term downtrend and pushed to the bottom of its recent trading range. The move matters less as a one-day print than as a signal: Tencent is now trading below its SMA20 at 442.83 and well under its SMA50 at 456.04, which tells readers that recent price action is not just noisy but still working against the longer trend. The chart also shows the stock sitting just under the lower Bollinger band at 427.46, a position that often reflects pressure rather than stability, even if it can sometimes precede a rebound.
Trend & Price Action
The structure is still tilted lower. The downtrend is backed by the SMA20 slope of -1.75% over five days, which means the short-term average itself is falling, not merely being crossed by price. That distinction matters: when an average is sloping down, it often confirms that sellers have been in control for several sessions, not just on one weak day. Tencent’s price is also below both key moving averages, and with no fresh MA cross in place, there is no technical sign yet that the trend has turned.
The range context is equally telling. Tencent’s 20-hour support at 425.60 has now been tested, while 20-hour resistance sits at 457.00. In plain language, the stock is trading at the floor of its recent band, but the floor is thin because it is being tested in a weak trend. The 3-month range adds perspective: the stock is far from the 3-month high of 497.80 and not far above the 3-month low of 411.00, which means the market is still leaning toward the lower half of the broader range.
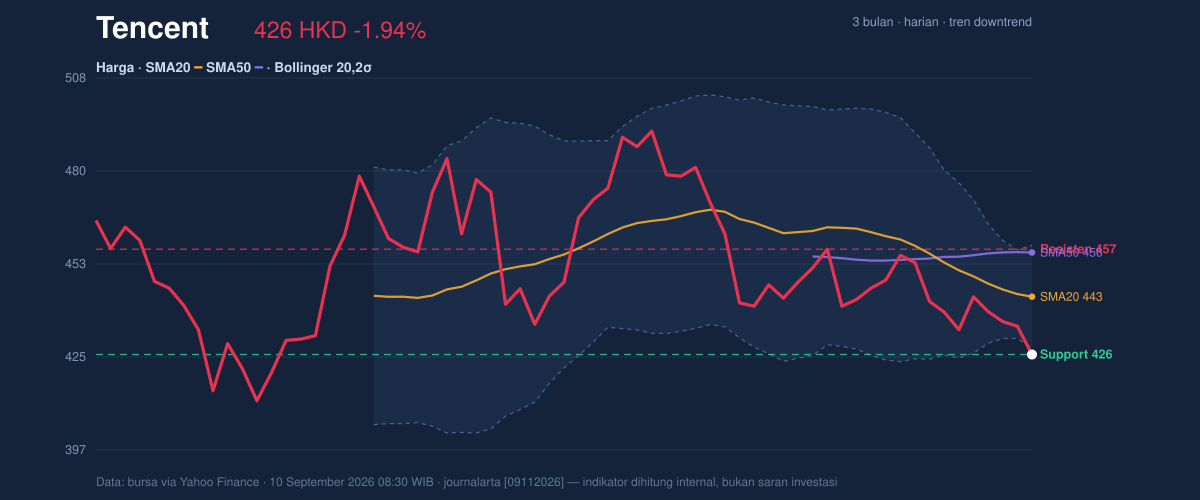
A short line says it plainly: the stock is not breaking down decisively, but it is also not showing the kind of strength that would normally precede a trend change.
Oscillators & Momentum
The momentum picture is mixed, and that mix is important. The RSI(14) at 37.3 is technically neutral, but it sits close enough to the lower end of the scale to show that Tencent has lost much of its near-term strength. More striking is the Stochastic %K at 1.6 and %D at 4.6, which places the stock in oversold territory. Oversold does not mean “cheap” in a fundamental sense; it means the stock has fallen fast enough that a bounce can develop if selling pressure eases.
Still, the broader momentum signal has not turned. The MACD at -6.844, below the signal line at -5.361, leaves a negative histogram of -1.483. That combination means downside momentum is still outweighing any attempted recovery. In practical terms, the stock may be near a point where it can bounce, but the trend-following indicator has not yet confirmed that the bounce is becoming something stronger.
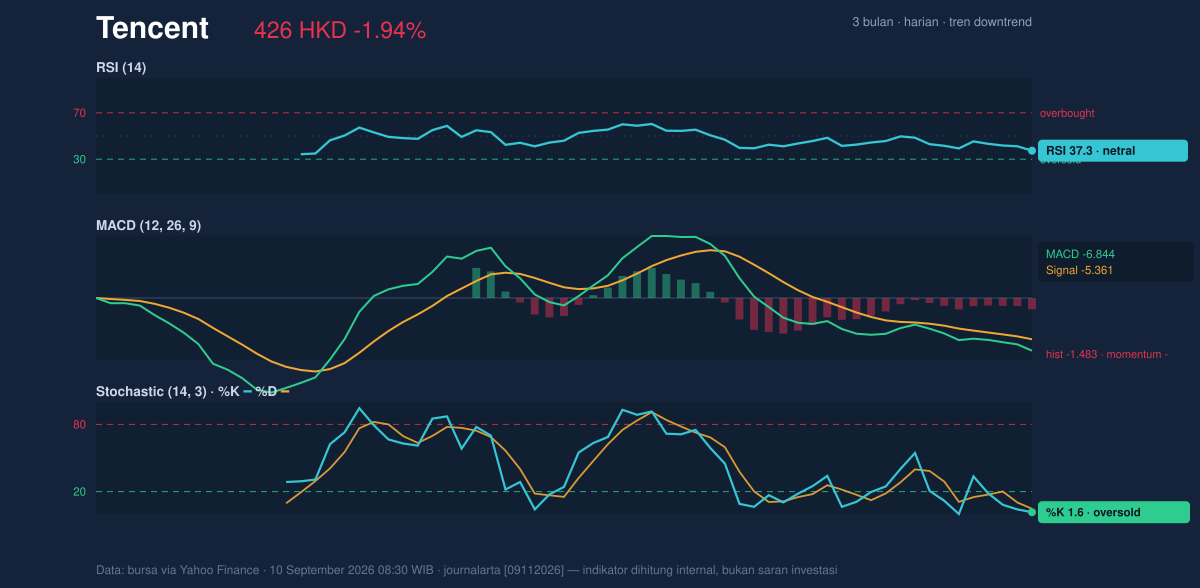
That is the tension in the chart: oversold on short-term oscillators, but still bearish on trend momentum.
Volatility & Volume
Volatility is not extreme, but it is active enough to matter. Tencent’s ATR(14) of 9.90, equal to 2.3% of price, suggests a normal-to-moderate daily swing range rather than a disorderly one. At the same time, the Bollinger band width of 6.9% is narrowing, which points to a squeeze. A squeeze often means the stock is compressing energy; the next move can be sharper once price escapes the band. The problem for Tencent is direction: a squeeze in a downtrend can resolve either way, but the current positioning under the middle band at 442.83 and near the lower band at 427.46 keeps the burden on buyers to prove they can reclaim control.
Volume is offering only partial confirmation. Last volume came in at 22,333,165, above the 20-hour average of 19,774,864, or 1.1 times normal. That shows participation, but not a dramatic surge strong enough to signal capitulation or a powerful reversal. The OBV is falling, which is the more important clue: on-balance volume tracks whether money flow is accumulating or leaving the stock, and a declining OBV says distribution remains in place.
So the market is active, but not yet convincing.
Key Levels & Scenarios
The immediate technical map is straightforward. Support at 425.60 is the first line to watch because price is already sitting on it. If that level fails, the next reference from the data is the 3-month low at 411.00, which would signal that the broader range is under renewed stress. On the upside, the first meaningful barrier is the lower Bollinger band at 427.46, followed by the SMA20 at 442.83. A stronger recovery would need to challenge resistance at 457.00, which also sits close to the SMA50 at 456.04, making that zone a heavier supply area.
The cleanest signal would come from how price behaves around the current support. A hold above 425.60 with improving momentum would suggest the oversold condition is starting to work. A break below it would confirm that sellers still have the upper hand.
Technical Verdict: HOLD (wait & see)
HOLD (wait & see) fits the current setup because Tencent is technically oversold, but the trend remains negative and the MACD has not turned. The chart is showing pressure near support rather than a confirmed reversal.
- Reason 1: MACD is negative and the histogram remains below zero, which means downside momentum is still in place.
- Reason 2: Price is below SMA20 and SMA50, so the stock has not yet reclaimed the trend structure.
- Reason 3: Stochastic is oversold, but that alone is not enough to confirm a reversal while OBV is still falling.
- Invalidation condition: the verdict is invalidated if price falls below 425.60, with 411.00 then becoming the next downside reference.
- Ideal Entry Range: 425.60 to 427.46
- Exit Target (Target Price): 442.83, then 457.00 if recovery extends
- Stop Loss protection: below 425.60, with 411.00 as the deeper risk marker
For non-traders, this means Tencent is sitting at a point where a bounce is possible, but the chart has not yet shown enough strength to call the turn.
“The stock is compressed near support, but the burden is still on buyers to prove they can take it back above the trend lines.”
Summary Data Tencent
| Last price | 425.60 HKD |
| Change 1 day / 5 days / 1 month | -1.94% / -1.71% / -3.49% |
| Trend / MA-cross | downtrend / none |
| SMA20 / SMA50 | 442.83 / 456.04 |
| RSI (14) / Stochastic %K | 37.3 / 1.6 |
| Bollinger %B / ATR | -6% / 9.90 |
| Support / Resistance 20 days | 425.60 / 457.00 |
| Data as of | 10 September 2026 08:30 WIB |
Track Tencent share price daily: live levels, support/resistance and our full Tencent analysis history.