Momentum Gains, WMT Stock Gains 1.34% Today
On September 14, 2026: price 107.15 USD, trend downtrend, RSI 46.8, support 102.63, resistance 115.27. technical analysis of wmt stock.

Walmart is holding above a short-term floor even as its broader price trend remains under pressure, leaving the stock in a technically fragile but not broken position. The latest move on the NYSE, where WMT last traded at 107.15 USD after a 1.34% daily gain, looks more like a rebound inside a downtrend than a clean reversal, especially with the shares still below the 20-day average of 107.29 and well under the 50-day average of 110.33.
Trend & Price Action
The chart shows a stock that has been drifting lower rather than collapsing, which matters because persistent declines often begin with a series of smaller failed recoveries. Walmart’s 1-month decline of 7.41% and the downtrend reading from the SMA20 slope of -1.72% over 5 days signal that sellers have kept control of the intermediate trend. The absence of a fresh moving-average crossover also suggests there is no decisive technical shift yet; in plain terms, the chart has not produced the kind of signal that usually marks a regime change.
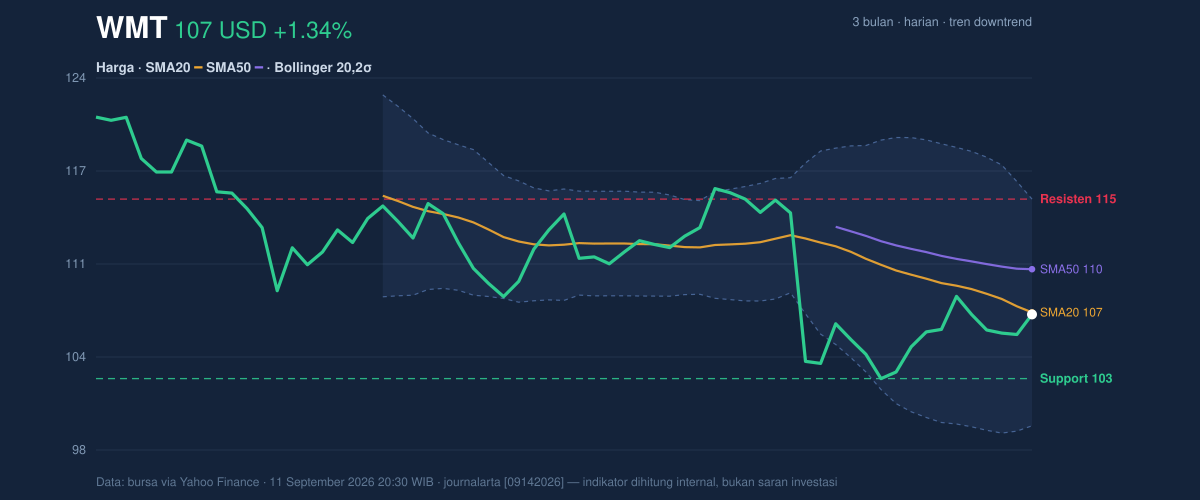
The stock is also trading in the lower half of its recent range, at 36% of the 20-hour range, which tells readers the rebound has not yet recovered enough ground to challenge the upper band of resistance. That upper barrier sits at 115.27 USD, while the key support is 102.63 USD. The 3-month high of 122.94 USD and 3-month low of 102.15 USD frame the current move as a test of whether the recent floor can keep holding before the market revisits the lower end of the range.
Oscillators & Momentum
Momentum is mixed, and that is the most important nuance in the data. The RSI at 46.8 is neutral, meaning the stock is neither stretched to the upside nor oversold enough to imply an automatic bounce. The Stochastic %K at 68.9 and %D at 56.6 also sit in neutral territory, but they are leaning higher, which often indicates short-term recovery pressure is building even when the broader trend has not turned.
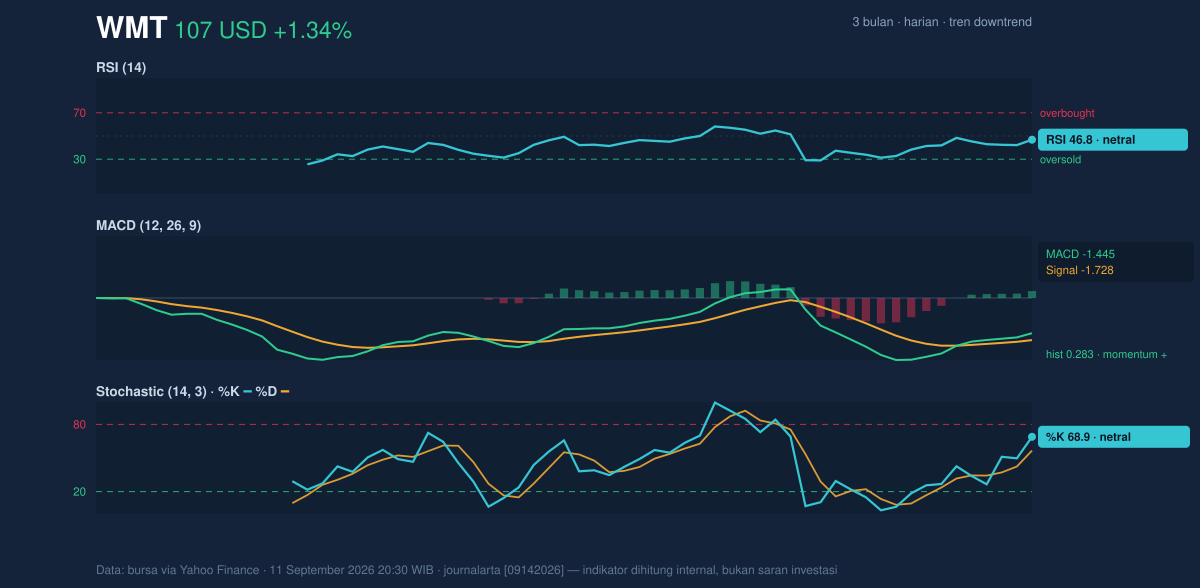
The most constructive signal comes from the MACD at -1.445, which remains below zero but sits above the signal line at -1.728, leaving a positive histogram of 0.283. For non-specialists, that means downside momentum is easing even though the stock is not yet in an outright bullish phase. In other words, the price is still technically weak, but the rate of weakness has slowed enough to hint at stabilization.
Volatility & Volume
Volatility is moderate rather than extreme. The ATR of 1.90, equal to 1.8% of price, points to a market that is moving enough to matter but not enough to suggest panic or disorder. The Bollinger Bands reinforce that view: the %B reading of 49% places the stock close to the middle band, and the 14.9% band width is described as normal, not compressed or expanded. That combination usually signals balance, not a breakout in progress.
The volume picture adds a useful caution. The latest trading day saw 17,058,300 shares, well below the 20-day average of 27,794,060, or about 0.6x normal. That means the bounce happened on lighter participation, which makes it less convincing as a trend-changing move. Still, OBV is rising, and that matters because on-balance volume tracks whether money is steadily accumulating over time. A rising OBV against softer day-to-day volume can suggest that larger holders are not aggressively exiting, even if the market has not yet committed to a stronger uptrend.
Key Levels & Scenarios
The chart’s structure is straightforward. 102.63 USD is the first level bulls need to defend, because it marks the nearest support and sits close to the 3-month low of 102.15 USD. If that area gives way, the technical picture would weaken further and invite a retest of the lower range boundary. On the upside, 107.29 USD is the immediate moving-average hurdle, followed by 110.33 USD, where the 50-day average may act as a heavier ceiling. Above that, 115.27 USD is the broader resistance level that would need to be reclaimed to shift the story from stabilization to genuine repair.
Because the price is below SMA20 and SMA50 while MACD is improving, the stock sits in a transition zone: trend still negative, momentum less negative, volume not yet convincing. That is often the part of the chart where false starts are common, so the market will likely need a stronger close above the moving averages to prove that the rebound has more than short-term energy.
Technical Verdict: HOLD (wait & see)
HOLD (wait & see) fits the chart best because the stock is still in a downtrend, remains below SMA20 and SMA50, and the latest gain came on below-average volume. The constructive side is that MACD is positive versus its signal line, OBV is rising, and price is not far from the middle Bollinger band, which suggests the decline may be losing force. The neutral RSI and stochastic readings support patience rather than conviction.
- Ideal Entry Range: 102.63–107.29 USD, using support and the 20-day average as the technical zone of interest.
- Exit Target: 110.33 USD, with 115.27 USD as the stronger resistance ceiling if momentum improves.
- Stop Loss protection: below 102.15 USD, the 3-month low and nearby support floor.
- Verdict invalidated if price breaks below 102.63 USD, because that would weaken the current base and reopen the lower range.
For non-traders: the chart says Walmart is trying to steady itself, but it has not yet proved that the decline is over.
Summary Data WMT
| Last price | 107.15 USD |
| Change 1 day / 5 days / 1 month | 1.34% / -1.17% / -7.41% |
| Trend / MA-cross | downtrend / none |
| SMA20 / SMA50 | 107.29 / 110.33 |
| RSI (14) / Stochastic %K | 46.8 / 68.9 |
| Bollinger %B / ATR | 49% / 1.90 |
| Support / Resistance 20 days | 102.63 / 115.27 |
| Data as of | 11 September 2026 20:30 WIB |



