OCBC Stock Technicals Today: Gains 0.67%, Momentum Weakens
On September 14, 2026: price 31.60 SGD, trend sideways, RSI 59.3, support 30.78, resistance 32.27. technical analysis of ocbc stock. OCBC Stock Technicals —…

OCBC Bank’s shares on SGX edged up to 31.60 SGD on 11 September 2026, a modest gain from the previous close of 31.39, but the tape still reads more as consolidation than conviction. The stock is sitting above its short- and medium-term averages, yet the recent pullback over 5 days and the flat 1 month performance show that buyers have not yet turned the move into a clean trend. As shown in the chart, the price is holding near the middle of its recent range, which often signals a market waiting for a catalyst rather than one already committed to a direction.
Trend & Price Action
The broad structure remains sideways, even though the share price is trading above SMA20 at 31.39 and well above SMA50 at 29.80. That matters because it tells us the stock is not under medium-term pressure; instead, the market is pausing after a recovery phase. A positive slope in the SMA20 — 0.28% over 5 days — suggests the short-term base is still rising, but the lack of a fresh MA-cross means the chart has not produced a new trend signal to confirm stronger directional momentum.
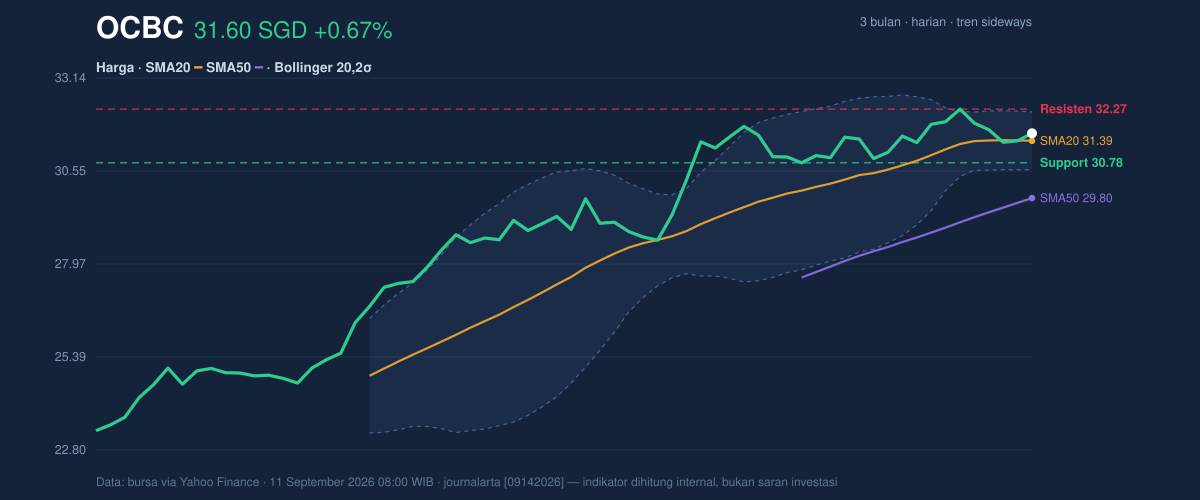
The price is also positioned around 55% of the 20-hour range, with support at 30.78 and resistance at 32.27. That placement is important: it shows the stock is neither pressing against the ceiling nor testing the floor, which usually leaves room for either a breakout attempt or a drift back toward support. The 3-month high of 32.57 sits close enough to current levels to matter, because the market is only a small step away from probing that upper boundary again. But the 3-month low of 23.11 remains far below, underscoring how much of the earlier recovery has already been retained.
Oscillators & Momentum
Momentum indicators are mixed rather than aligned, and that is the main reason the chart still looks hesitant. The RSI at 59.3 is neutral-to-firm, which usually means the stock has room to rise without being stretched. The Stochastic %K at 43.6 and %D at 40.7 are also neutral, pointing to a market that is not yet overbought and not yet washed out. In plain language, these oscillators say the stock has not lost its footing, but they also do not show a strong acceleration phase.
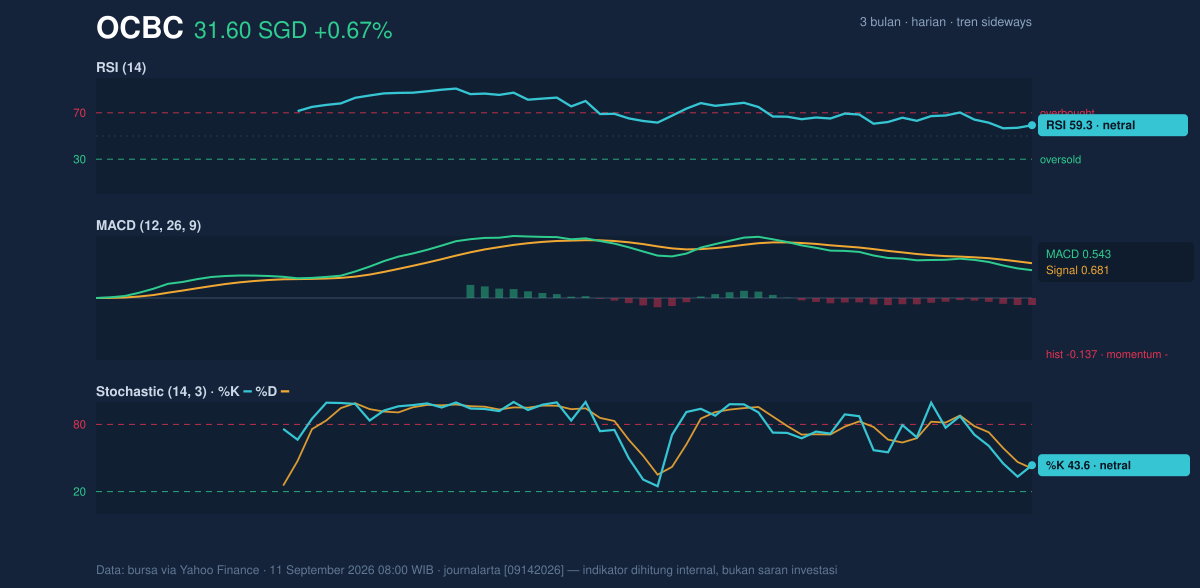
The more cautious signal comes from MACD at 0.543 versus the signal line at 0.681, with a histogram of -0.137. When the histogram is negative, it means short-term momentum is running behind the trend line, a common sign that the latest push is fading. That does not automatically imply a reversal, but it does mean the current rise in price is not yet fully confirmed by momentum. For traders who read the chart closely, that is a warning that the stock may need more volume or a clean break above resistance before the next leg can establish itself.
Volatility & Volume
Volatility is contained, but not dead. The Bollinger Bands are relatively tight, with the upper band at 32.19, the middle at 31.39, and the lower at 30.59; the 5.1% band width is described as a squeeze, which often precedes a sharper move. That is the key signal here. A squeeze does not predict direction, but it does indicate compression: the stock is storing energy, and compressed ranges often resolve with a stronger move once one side of the market gains control.
The ATR(14) at 0.50, or 1.6% of price, points to moderate day-to-day movement. That supports the idea that the stock is not in a high-stress phase, but it can still travel enough to challenge nearby levels. Volume, however, is the missing confirmation. Last trade volume of 2,834,300 is only about 0.5x the 20-hour average of 5,438,720, so the latest advance did not come with broad participation. That matters because price gains on light activity can be fragile. The one constructive counterpoint is that OBV is rising, which suggests the longer-term flow of shares has remained supportive even if the latest session was quiet.
Key Levels & Scenarios
The chart’s immediate decision points are straightforward. A push through 32.27 resistance would place the stock within striking distance of the 32.57 3-month high, and that would be the first sign that the squeeze is resolving upward. If instead the price fails to hold above 30.78 support, the market would likely be signalling that the recent base is weakening and that the sideways pattern is tilting back toward consolidation lower in the range. The Bollinger lower band at 30.59 sits just below that support, so a break there would matter because it would show the stock is slipping out of its compressed zone.
Technical Verdict: HOLD (wait & see)
HOLD (wait & see) is the clearest technical reading because the chart is constructive but not confirmed.
- Reason 1: Price is above SMA20 and SMA50, which keeps the broader structure intact.
- Reason 2: Bollinger Bands are in a squeeze, so a larger move may be building.
- Reason 3: MACD histogram is negative, showing momentum has not fully caught up with price.
Verdict invalidated if price falls below 30.78, as that would break the nearest support and weaken the current range.
- Ideal Entry Range: 30.78 to 31.39
- Exit Target (Target Price): 32.27 to 32.57
- Stop Loss protection: below 30.59
For non-traders, this means OCBC is holding steady, but the chart still needs a stronger push or a clearer pullback before the next move becomes obvious.
Summary Data OCBC
| Last price | 31.60 SGD |
| Change 1 day / 5 days / 1 month | 0.67% / -2.08% / -0.60% |
| Trend / MA-cross | sideways / none |
| SMA20 / SMA50 | 31.39 / 29.80 |
| RSI (14) / Stochastic %K | 59.3 / 43.6 |
| Bollinger %B / ATR | 63% / 0.50 |
| Support / Resistance 20 days | 30.78 / 32.27 |
| Data as of | 11 September 2026 08:00 WIB |



