PG Stock Analysis: Gains 1.61%, Momentum Gains
On September 14, 2026: price 145.27 USD, trend sideways, RSI 49.7, support 142.64, resistance 147.64. technical analysis of pg stock. PG Stock Analysis — full…

Procter & Gamble’s shares rose to $145.27 on 11 September 2026, up 1.61% from the previous close of $142.97, but the move still leaves the stock trapped in a sideways pattern rather than a clean trend. The key signal is not the day’s gain itself; it is that price is holding above the 20-day average at $144.79 while remaining below the 50-day average at $146.42, a setup that usually points to a market still deciding whether the recent bounce has enough force to challenge overhead supply. As shown in the chart, the stock is sitting in the middle of its near-term range, with momentum improving but not yet decisive.
Trend & Price Action
PG’s structure is best described as a sideways trend with a slight negative tilt in the short-term average, as the SMA20 slope is -0.10% over 5 days. That matters because a flat-to-soft moving average often signals balance between buyers and sellers rather than a strong directional move. Price being above the SMA20 shows the latest rebound has reclaimed some near-term ground, but below the SMA50 means the longer short-term trend has not yet been fully repaired. In practical terms, the stock is hovering between two reference points that often act like a ceiling and a floor. The 20-hour support at $142.64 and resistance at $147.64 frame the immediate battleground, while the 3-month range of $140.20 to $154.32 shows PG is still well inside a broader consolidation band.
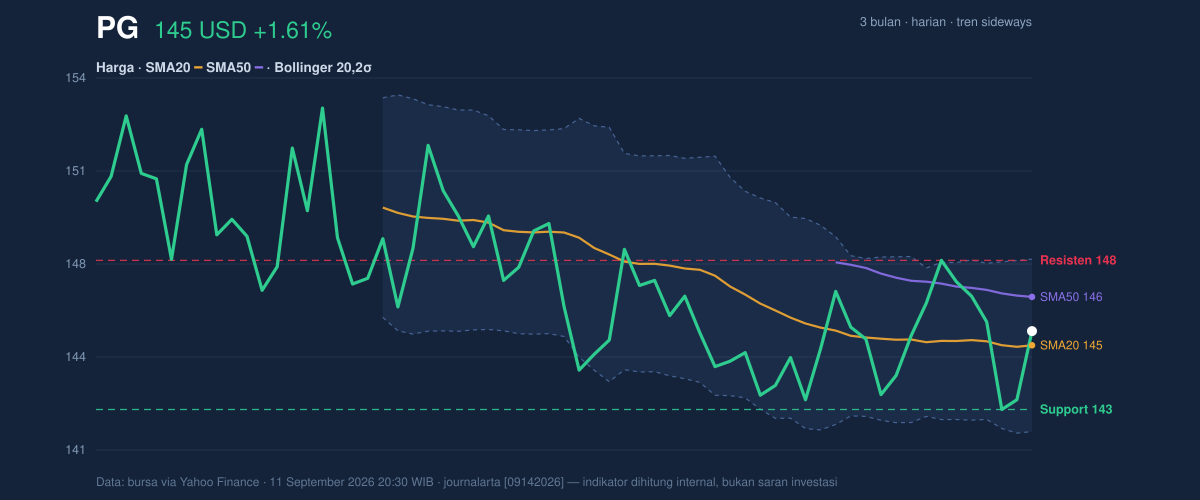
The position at 53% of the range is important: it suggests the stock is neither stretched at the top nor under pressure at the bottom. That middle-ground placement usually leaves room for either direction, but only if price can escape the current compression.
Oscillators & Momentum
The momentum picture is neutral, but with a slight constructive bias. The RSI(14) at 49.7 sits almost exactly at the midpoint, which means the stock is neither overbought nor oversold. That is often the mark of a market waiting for a catalyst rather than one already in motion. The Stochastic %K at 52.5 and %D at 25.9 is also neutral, though the gap between the two lines hints that short-term upward pressure is trying to build. In plain language, stochastic compares where price sits within its recent range; when the faster line starts to pull ahead, it can suggest buyers are regaining control, but not yet strongly enough to declare a trend change.
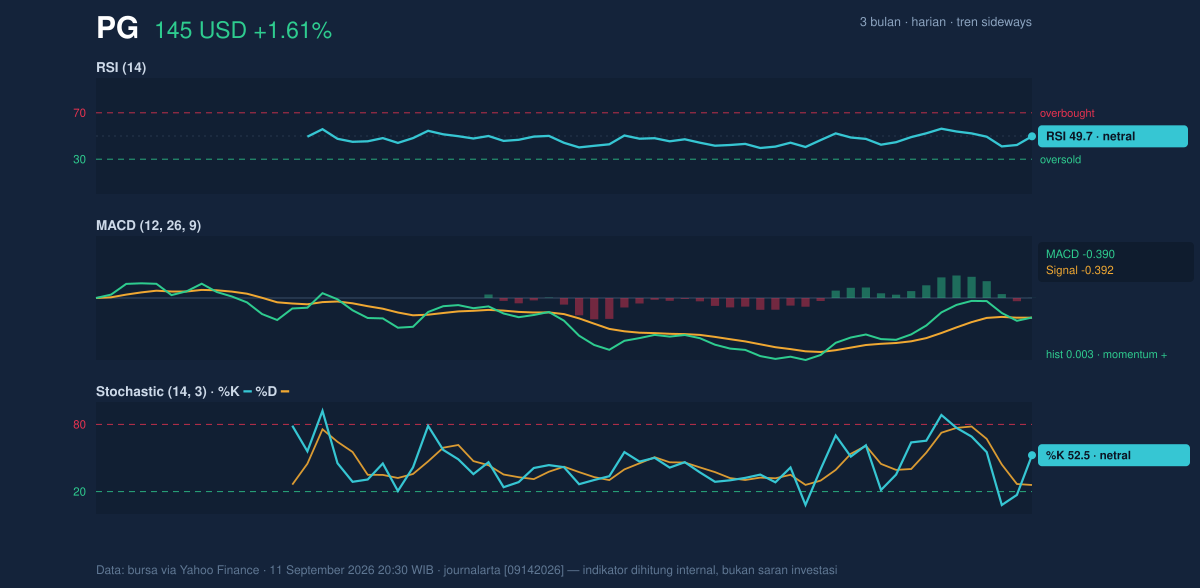
The most encouraging element is the MACD at -0.390 versus a signal line of -0.392, with a histogram of 0.003. That tiny positive histogram means the MACD line has edged just above its signal line, a classic early sign that downside momentum is fading. It is not a powerful bullish signal on its own, but it does show that selling pressure has eased enough for the stock to stabilize. Put simply: momentum is no longer pushing PG lower, yet it has not fully turned into a strong upside drive.
Volatility & Volume
Volatility is contained but not dormant. The Bollinger Band width of 4.0% is described as a squeeze, which often means the stock is coiling for a larger move after a quiet spell. The middle band at $144.79 is effectively aligned with the SMA20, reinforcing the idea that this is a consolidation zone. Price at 58% of the Bollinger band shows PG is leaning slightly toward the upper half of the recent envelope, but not enough to confirm a breakout. The upper band at $147.69 is especially relevant because it sits just above the current resistance level, making that area the first real test of whether the squeeze resolves upward.
Volume adds a modest confirmation layer. Last volume of 11,526,600 was about 1.2× normal versus the 20-day average of 9,364,360, and OBV is rising. OBV, or on-balance volume, tracks whether trading activity is accumulating in a way that supports price. A rising OBV alongside price stabilization tells us the recent advance is being backed by participation, not just thin trading. Still, the volume pickup is supportive rather than emphatic; it strengthens the rebound, but does not yet prove a full trend reversal.
Key Levels & Scenarios
The immediate map is clear. $142.64 is the nearest support to watch; if that level holds, the current rebound remains intact. Above current price, $147.64 and the Bollinger upper band at $147.69 form a tight resistance cluster. That clustering matters because when resistance and the volatility band line up, the market often needs a stronger burst of demand to clear both at once. A move through that zone would improve the case that PG is escaping its sideways pattern. On the downside, a failure to hold $144.79 would place the stock back at the center of its recent range and weaken the short-term recovery narrative.
If price breaks above $147.64/$147.69, the chart would signal a more convincing shift toward the upper end of the $140.20 to $154.32 range. If it fails to hold $142.64, the market would be telling us that the rebound has lost traction and the squeeze is resolving without follow-through.
Technical Verdict: HOLD (wait & see)
Hold fits best because PG is showing price above SMA20, rising OBV, and a slightly positive MACD histogram, but it is still below SMA50 and the RSI remains neutral. The Bollinger squeeze suggests a larger move may be coming, yet the direction is not confirmed. The verdict is invalidated if price breaks below $142.64, because that would weaken both the support structure and the current recovery attempt.
- Ideal Entry Range: $144.79 to $147.64
- Exit Target: $147.69 initially, with the next reference toward the upper part of the $140.20 to $154.32 range if resistance gives way
- Stop Loss Protection: below $142.64
For non-traders, PG is trying to recover, but it has not yet proved that the rebound is strong enough to leave the sideways range behind.
Volume last traded at 11,526,600 shares, above the 20-day average of 9,364,360.
Summary Data PG
| Last price | 145.27 USD |
| Change 1 day / 5 days / 1 month | 1.61% / -1.12% / 0.70% |
| Trend / MA-cross | sideways / none |
| SMA20 / SMA50 | 144.79 / 146.42 |
| RSI (14) / Stochastic %K | 49.7 / 52.5 |
| Bollinger %B / ATR | 58% / 2.19 |
| Support / Resistance 20 days | 142.64 / 147.64 |
| Data as of | 11 September 2026 20:30 WIB |



