AIA Stock Analysis: Gains 0.53%, Momentum Weakens
On September 15, 2026: price 75.45 HKD, trend sideways, RSI 49.3, support 72.55, resistance 77.50. technical analysis of aia stock. AIA Stock Analysis — full…

AIA Group’s shares edged up to 75.45 HKD on HKEX, a 0.53% daily gain that sits inside a broader sideways pattern rather than a decisive trend. The move matters less for its size than for where it occurred: the stock is trading just above its short-term averages, while momentum indicators remain mixed, suggesting the market is still waiting for a cleaner signal. As shown in the chart, AIA is holding near the middle of its recent range, with neither buyers nor sellers yet forcing a break.
Trend & Price Action
The price structure is best described as cautious consolidation. AIA is trading above SMA20 at 75.33 and fractionally above SMA50 at 75.39, which keeps the chart from slipping into outright weakness. But the lack of a fresh moving-average crossover also means there is no strong trend confirmation. In plain terms, the shares are not breaking down, but they are not accelerating higher either.
The sideways trend is reinforced by the narrow separation between the two averages and the modest 1.20% rise in the SMA20 slope over five days. That slope suggests the short-term base is still inching higher, but only gradually. The stock’s position at 59% of its 20-hour range also points to balance rather than conviction. It is closer to the upper half of the corridor, yet not close enough to resistance to imply a breakout is already underway.
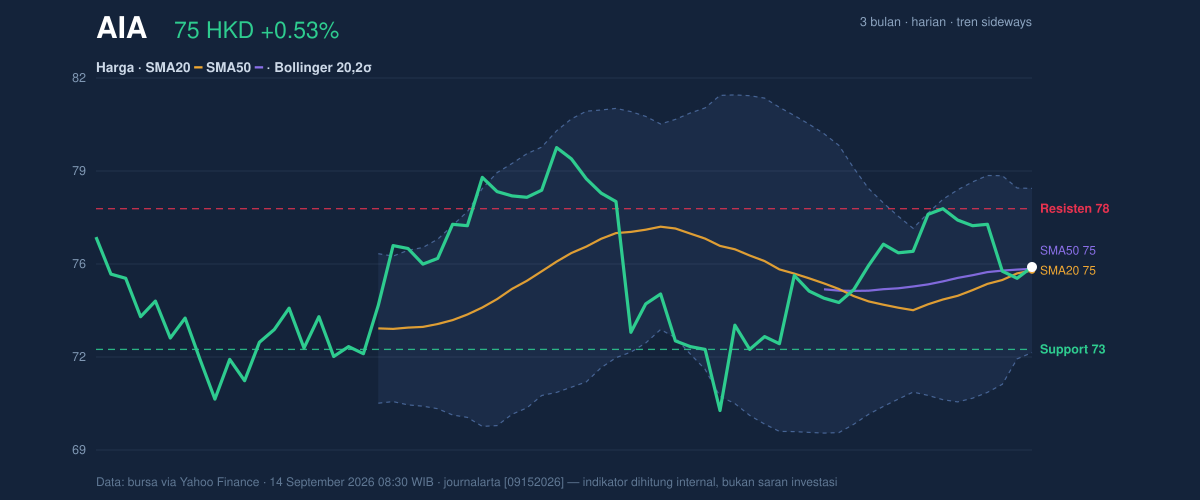
The broader range gives the move context. AIA remains below its 3-month high of 80.15 and above its 3-month low of 69.35, which is another way of saying the market has spent the period digesting gains rather than extending them. The key question is whether the current base becomes a launch pad or just another pause.
Oscillators & Momentum
Momentum is the part of the chart that keeps the picture from turning decisively bullish. The RSI at 49.3 is neutral, sitting almost exactly where one would expect in a balanced market. That reading signals neither overbought enthusiasm nor oversold stress. It usually means price is being accepted, but not strongly chased.
The Stochastic %K at 39.6 and %D at 33.8 are also neutral, though slightly improved from a deeper weakness zone. Stochastic is useful for spotting turning points in short-term momentum. Here, it says the stock has room to move either way, but no clear reversal trigger has been confirmed.
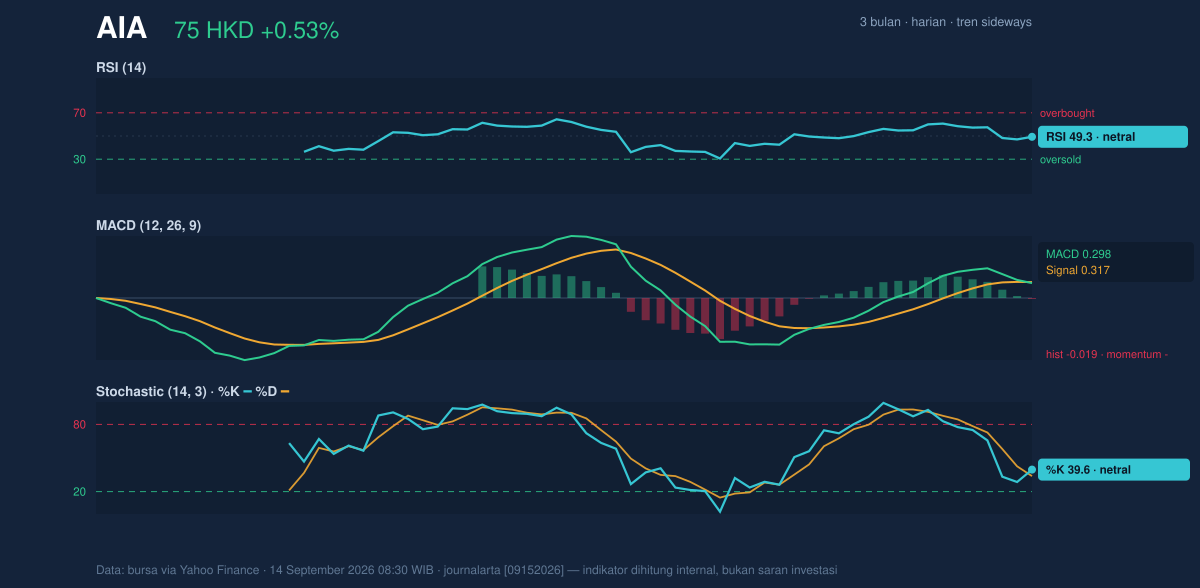
The more telling detail is the MACD at 0.298 versus the signal line at 0.317, leaving a -0.019 histogram. That negative histogram means short-term momentum is still lagging the longer baseline, even though the gap is small. In practical terms, the shares are not in a strong downtrend, but the latest push lacks enough force to overtake the prevailing rhythm. That is why the chart reads as consolidation with a slight momentum drag, not a breakout setup with full confirmation.
Volatility & Volume
Volatility is contained, but not dead. The Bollinger Bands are relatively tight, with the upper band at 78.21 and the lower band at 72.44, while the band width of 7.7% points to a squeeze. A squeeze often means the market is storing energy. It does not predict direction, but it does raise the odds of a larger move once price escapes the band structure.
The current %B at 52% places AIA almost exactly in the middle of the Bollinger envelope. That is a neutral location, but it becomes more interesting when paired with the squeeze: the stock is compressed, not extended. Traders often watch this kind of setup for a volatility release, especially when price is hovering near the middle band at 75.33.
Volume adds a second layer of caution. Last trade volume of 23,888,451 was only 0.9× the 20-hour average of 26,860,599. That means the latest uptick was not powered by unusually strong participation. Still, OBV is rising, which matters because on-balance volume tracks whether money flow is quietly accumulating over time. The combination of lighter daily volume and rising OBV suggests buyers have not disappeared, but they are not yet committing aggressively enough to force a breakout. ATR at 1.57, equal to 2.1% of price, confirms the market is moving with moderate day-to-day range risk rather than sharp turbulence.
Key Levels & Scenarios
The first level to watch on the upside is 77.50, the 20-hour resistance. A clean move through that area would matter because it would place price closer to the upper Bollinger band at 78.21 and shift the chart from mid-range drift toward a more constructive test of recent highs. Above that, the next reference is the 3-month high of 80.15, which marks the ceiling of the larger range.
On the downside, 72.55 is the immediate support. That level sits just above the lower Bollinger band at 72.44, so a failure there would be more than a routine pullback; it would suggest the squeeze is resolving lower. If that floor gives way, the market would be looking back toward the 3-month low of 69.35 as the next major reference.
The present setup is therefore a narrow balance: price is above the short-term averages, but momentum has not confirmed strength and volume has not expanded enough to validate a push. That is why the chart still looks like a waiting pattern, not a completed trend change.
Technical Verdict: HOLD (wait & see)
- Reason 1: Price is only marginally above SMA20 at 75.33 and SMA50 at 75.39, so trend support exists, but it is thin.
- Reason 2: RSI 49.3 and Stochastic %K 39.6 / %D 33.8 are neutral, while MACD histogram -0.019 shows momentum is still slightly negative.
- Reason 3: Bollinger Bands are squeezing and OBV is rising, which hints at potential expansion, but the latest volume at 0.9× normal does not yet confirm a forceful move.
- Verdict invalidated if price breaks below 72.55, because that would undermine the current base and expose the lower range.
- Ideal Entry Range: 72.55 to 75.39
- Exit Target: 77.50 to 78.21
- Stop Loss: below 72.44, with 69.35 as the deeper risk marker
For non-traders: the stock is holding steady, but the chart still needs a stronger push or a cleaner pullback before it shows its next clear direction.
Summary Data AIA
| Last price | 75.45 HKD |
| Change 1 day / 5 days / 1 month | 0.53% / -2.14% / 2.79% |
| Trend / MA-cross | sideways / none |
| SMA20 / SMA50 | 75.33 / 75.39 |
| RSI (14) / Stochastic %K | 49.3 / 39.6 |
| Bollinger %B / ATR | 52% / 1.57 |
| Support / Resistance 20 days | 72.55 / 77.50 |
| Data as of | 14 September 2026 08:30 WIB |



