Alibaba Stock Technicals Today: Drops 1.49%, Death Cross Pressure
On September 15, 2026: price 105.90 HKD, trend downtrend, RSI 36.1, support 105.90, resistance 126.70. technical analysis of alibaba stock.

Alibaba Group’s Hong Kong-listed shares fell to HKD 105.90 on 14 September 2026, extending a slide that has now taken the stock 1.49% lower on the day, 3.38% over five days and 13.34% over one month, according to exchange-linked market data via Yahoo Finance. The move matters because it leaves the stock trading below its short- and medium-term trend lines, while momentum gauges are showing the kind of pressure that usually appears when sellers are still in control but the market is already approaching a technical floor.
Trend & Price Action
The chart shows a clear deterioration in structure: Alibaba is in a downtrend, with the SMA20 at HKD 113.70 sloping down 3.13% over five days and the shares sitting below the SMA20 and below the SMA50 at HKD 115.29. That matters because moving averages are not just lines on a chart; when price stays beneath them, it usually signals that recent buyers are failing to regain control. The bigger signal is the death cross, where the SMA20 has crossed below the SMA50. In plain language, the short-term trend has weakened enough to undercut the broader trend, a setup that often keeps rallies contained unless price can reclaim those averages decisively.
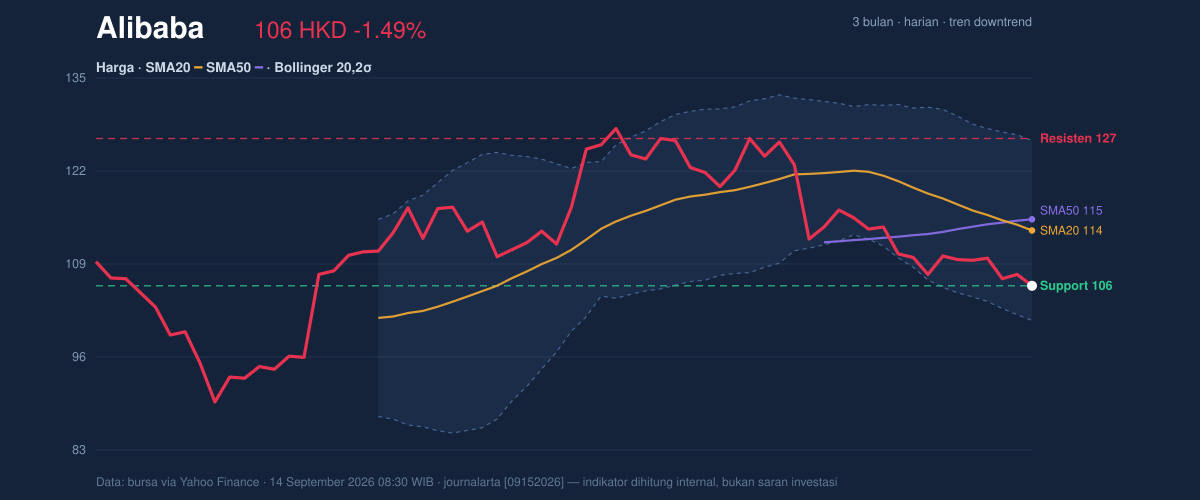
The current price is also pressing the lower end of the recent range. The 20-hour support at HKD 105.90 is effectively where the stock is trading now, while 20-hour resistance stands at HKD 126.70. That places the shares at 0% of the 20-hour range, a sign that the market is testing the floor rather than building a base in the middle of the band. The broader three-month range, from HKD 88.65 to HKD 130.30, shows there is still room below if support gives way.
A weak close near support can be a warning, not a relief.
Oscillators & Momentum
Momentum indicators are mixed in a way that often appears near oversold conditions, but not yet in a confirmed rebound. The RSI(14) at 36.1 is described as neutral, which means selling pressure has eased from extreme levels but has not fully reversed. More telling is the stochastic reading: %K at 9.2 and %D at 14.7 are both in oversold territory. Stochastic is a short-term timing tool, so readings this low can indicate that the stock has fallen quickly enough to become stretched. However, oversold does not mean it must bounce immediately; it simply means downside may be more vulnerable to a pause or a reflex move if selling slows.
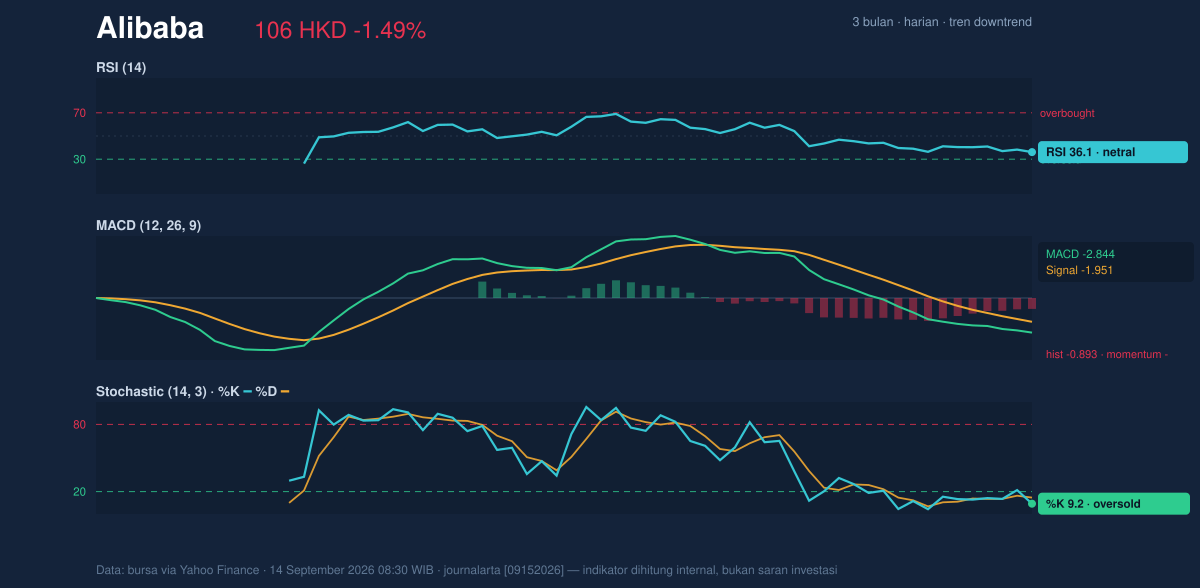
The MACD at -2.844, with the signal line at -1.951 and a histogram of -0.893, keeps the broader momentum picture negative. MACD is useful because it shows whether trend acceleration is improving or worsening. Here, the negative histogram says bearish momentum is still running ahead of any recovery attempt. In other words, the stock may be oversold in the short term, but the trend has not yet turned.
That combination is important: oversold, but still falling.
Volatility & Volume
Volatility is elevated enough to keep the stock in motion, but not so extreme that the chart looks chaotic. The Bollinger Bands are wide, with the upper band at HKD 126.41, the middle band at HKD 113.70 and the lower band at HKD 101.00. The %B at 19% means the price is sitting close to the lower band, a zone that often reflects stress in the trend. The 22.4% band width shows the bands have expanded, which usually happens when volatility rises and a stock starts making more decisive directional moves. In this case, the expansion is consistent with the recent decline rather than a calm consolidation.
The ATR(14) at 3.27, equal to 3.1% of price, confirms that daily movement remains meaningful. ATR measures typical trading range, so a reading like this suggests the stock can still travel far enough in either direction to matter to short-term traders. But volume is the caution flag: last session’s volume was 48,442,049, about 0.5x the 20-session average of 97,082,672, and OBV is down. That combination says the decline is not being met with strong accumulation. Lower volume on a fall can sometimes mean selling is tiring; here, the falling OBV argues that distribution has still been the dominant pattern.
Key Levels & Scenarios
The immediate technical map is straightforward. HKD 105.90 is the first line to watch because it is both the latest price and the 20-hour support. Below that, the next meaningful reference from the data is the Bollinger lower band at HKD 101.00, which often acts as a magnet when downside pressure persists. On the upside, the first barrier is HKD 113.70, where the SMA20 and Bollinger middle band coincide, followed by the SMA50 at HKD 115.29 and then HKD 126.70 resistance. A move back above the moving averages would matter because it would show the stock is no longer trading beneath the trend structure that currently defines it.
If HKD 105.90 fails to hold, the chart points toward a test of HKD 101.00. If price can reclaim HKD 113.70, the tone would improve, but the death cross would still cap enthusiasm until HKD 115.29 is also recovered.
Technical Verdict: HOLD (wait & see)
HOLD (wait & see)
- Death cross and price below both SMA20 at HKD 113.70 and SMA50 at HKD 115.29 keep the trend negative.
- MACD remains negative, which means bearish momentum is still active even though Stochastic is oversold.
- Bollinger %B at 19% and price near HKD 105.90 support suggest the stock is stretched, but OBV down and weak volume show no firm accumulation yet.
- Invalidation condition: this verdict is invalidated if price breaks below HKD 101.00, the lower Bollinger band and next visible downside reference.
- Ideal Entry Range: HKD 101.00 to HKD 105.90
- Exit Target: HKD 113.70 to HKD 115.29
- Stop Loss protection: below HKD 101.00
For non-traders, this means the stock is weak, but it is close enough to support that the chart is waiting for proof before the next move.
The 20-hour resistance is HKD 126.70.
Summary Data Alibaba
| Last price | 105.90 HKD |
| Change 1 day / 5 days / 1 month | -1.49% / -3.38% / -13.34% |
| Trend / MA-cross | downtrend / death |
| SMA20 / SMA50 | 113.70 / 115.29 |
| RSI (14) / Stochastic %K | 36.1 / 9.2 |
| Bollinger %B / ATR | 19% / 3.27 |
| Support / Resistance 20 days | 105.90 / 126.70 |
| Data as of | 14 September 2026 08:30 WIB |



