Singtel Stock Analysis: Drops 0.89%, Testing Support Level
On September 15, 2026: price 4.46 SGD, trend sideways, RSI 48.7, support 4.40, resistance 4.56. technical analysis of singtel stock. Singtel Stock Analysis —…

Singapore Telecom (Singtel) on SGX slipped to SGD 4.46, down from SGD 4.50 previously, as traders kept the stock in a narrow sideways band rather than pushing it decisively higher or lower. The move matters less for the size of the drop than for what it says about positioning: the shares are sitting just under short-term trend support, with momentum softening but not yet broken, as shown in the chart.
Trend & Price Action
Singtel is still trading in a sideways trend, and that is the key signal in the current setup. The stock is below its SMA20 at SGD 4.49 but above its SMA50 at SGD 4.44, which usually means the market is hesitating between short-term weakness and a broader base that has not fully given way. There is no fresh MA-cross, so the chart is not flashing a new trend regime; instead, it is showing a market waiting for confirmation.
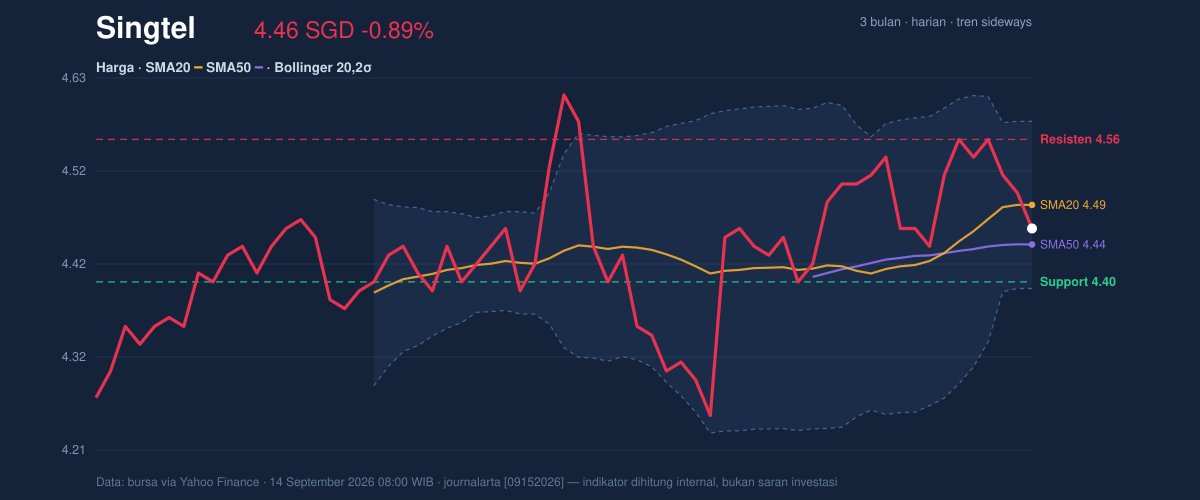
The price is also sitting in the lower half of the recent trading band, at 37% of the 20-hour range. That positioning is important because it suggests sellers have the upper hand intraday, but not enough force to force a clean breakdown. The 20-hour support at SGD 4.40 is the first line that matters, while SGD 4.56 remains the nearest cap. Between those two levels, the stock is effectively trapped in a compressed range, and the chart’s message is one of indecision rather than conviction.
The broader three-month range adds context. Singtel’s 3-month high is SGD 4.70 and the 3-month low is SGD 4.19, so current trading is closer to the lower end of that span than the top. That tells investors the market has not yet recovered enough to reclaim the upper part of the range, even though it has also avoided a deeper reset.
Oscillators & Momentum
Momentum indicators are pointing to caution, not panic. The RSI at 48.7 is neutral, which means the stock is neither stretched upward nor oversold. In plain language, the market is not showing the kind of extreme reading that often precedes a sharp reversal; it is simply drifting.
The Stochastic %K at 27.8 and %D at 49.1 are more interesting. This gap shows short-term price pressure has weakened faster than the slower signal line, a pattern that often appears when a stock is losing upward momentum before the broader trend has fully rolled over. It is not an outright sell signal on its own, but it does say buyers are not currently in control.
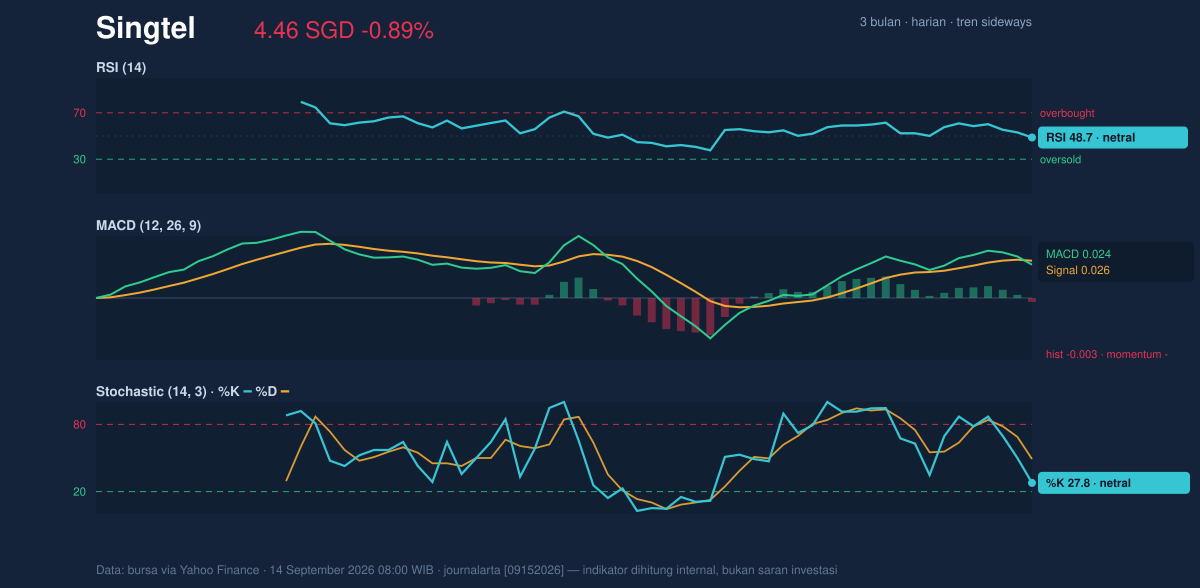
The MACD is 0.024 versus a signal line of 0.026, leaving a negative histogram at -0.003. That combination is a small but clear sign that momentum is slipping below its trigger line. In practical terms, it means recent price action is slightly weaker than the trend-following average, which often precedes either a pause or a test of support. Because the MACD is only marginally negative, the signal is more about fading strength than a full bearish breakdown.
Volatility & Volume
Volatility is contained, but it is compressing. The Bollinger Bands are tight, with the upper band at SGD 4.58, the middle at SGD 4.49, and the lower at SGD 4.39. The %B at 36% shows price is below the middle of the band structure, which usually reflects a softer tone. More importantly, the 4.2% band width indicates a squeeze, meaning the stock is coiling for a larger move after a period of calm. Squeezes do not tell direction by themselves, but they do warn that the current quiet can give way to a sharper break once a boundary gives.
The ATR(14) at 0.08, or 1.7% of price, confirms that day-to-day movement is moderate rather than erratic. That supports the idea that the market is still waiting for a catalyst. Volume, however, suggests the latest dip was not ignored: turnover at 24,400,800 was about 1.3x normal versus the 20-hour average of 19,244,783. Yet OBV is down, which matters because on-balance volume tracks whether volume is flowing with price or against it. A falling OBV while price sits near support implies distribution, or at least a lack of committed accumulation.
Key Levels & Scenarios
The market is now defined by a tight set of levels. SGD 4.40 is the first support to watch, and SGD 4.39 is reinforced by the lower Bollinger band. If that floor holds, the stock can remain in its current range and potentially retest SGD 4.49 and then SGD 4.56. If SGD 4.56 gives way, the chart would begin to look less range-bound and more constructive, with the upper band at SGD 4.58 and the 3-month high at SGD 4.70 becoming the next reference points.
If SGD 4.40 fails, the technical picture weakens quickly because price would be moving through both short-term support and the lower Bollinger boundary. That would leave the market exposed to a deeper retest of the broader range floor at SGD 4.19. For now, though, the stock is not there; it is still suspended between support and resistance with momentum leaning soft.
Technical Verdict: HOLD (wait & see)
HOLD (wait & see)
- RSI at 48.7 is neutral, so there is no strong momentum edge either way.
- MACD at 0.024 below signal at 0.026 and OBV falling both point to fading participation.
- Price below SMA20 at 4.49 but above SMA50 at 4.44 keeps the setup mixed rather than directional.
- Verdict invalidated if price falls below SGD 4.40, which would weaken support and the Bollinger floor.
- Ideal Entry Range: SGD 4.40 to SGD 4.44
- Exit Target: SGD 4.56 to SGD 4.58
- Stop Loss protection: below SGD 4.39
In plain English, the chart says Singtel is paused in a tight range, and the next decisive move will likely come only after one of those levels gives way.
The 3-month low is SGD 4.19.
Summary Data Singtel
| Last price | 4.46 SGD |
| Change 1 day / 5 days / 1 month | -0.89% / -2.19% / 0.00% |
| Trend / MA-cross | sideways / none |
| SMA20 / SMA50 | 4.49 / 4.44 |
| RSI (14) / Stochastic %K | 48.7 / 27.8 |
| Bollinger %B / ATR | 36% / 0.08 |
| Support / Resistance 20 days | 4.40 / 4.56 |
| Data as of | 14 September 2026 08:00 WIB |



