Testing Support Level, Tencent Stock Gains 0.51% Today
On September 15, 2026: price 430.60 HKD, trend downtrend, RSI 41.0, support 425.60, resistance 457.00. technical analysis of tencent stock.

Tencent Holdings slipped in Hong Kong on Monday, with 0700.HK last at 430.60 HKD, up 0.51% on the day but still below its short- and medium-term trend markers, according to data from the exchange feed via Yahoo Finance at 14 September 2026 08:30 WIB. The move matters less for the modest daily gain than for where the shares sit in the broader structure: price is below the 20-day SMA at 441.46 and well under the 50-day SMA at 455.55, a setup that says recent rebounds have not yet changed the underlying downtrend. The stock is also trading near the lower half of its 3-month range, and that positioning often tells a simple story: buyers are present, but not yet convincing enough to reclaim control.
Trend & Price Action
The chart shows Tencent still leaning lower, with the SMA20 slope at -1.18% over 5 days confirming that the short-term trend is pointing down rather than flattening out. There is no fresh MA-cross, which means there has been no technical shift strong enough to reverse the broader pressure. In plain language, the 20-day average remains below the 50-day average, and the market has not produced the kind of crossover that would usually signal a cleaner trend change. The stock’s latest close also sits only modestly above the 20-hour support at 425.60 and still far below the 20-hour resistance at 457.00, leaving it in a compressed middle zone where neither side has clearly won.
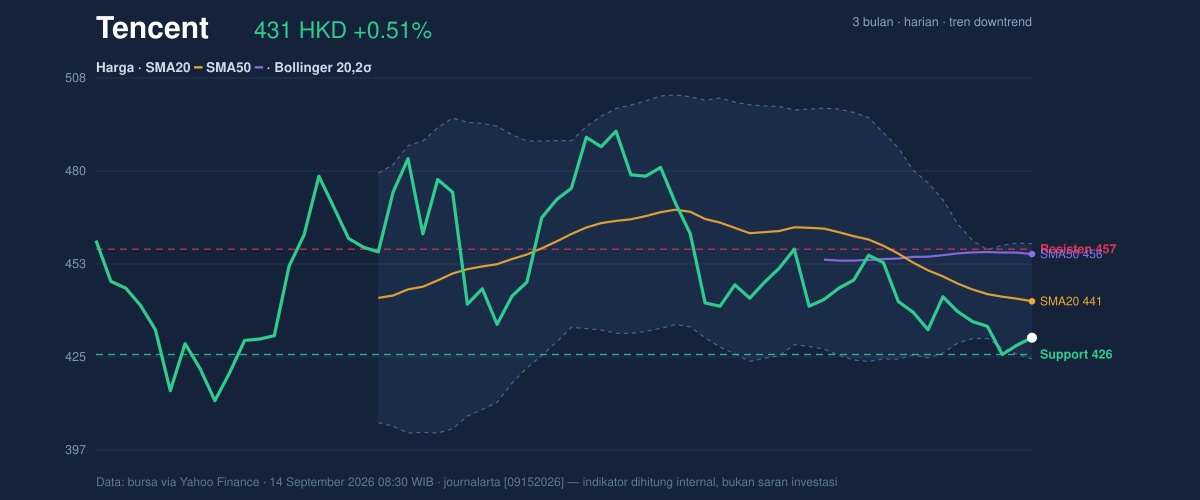
The location matters. At 430.60 HKD, Tencent is close to the lower edge of its Bollinger band structure, with the lower band at 424.26 and the %B at 18%. That means the share price is hugging the downside of its recent trading envelope, not collapsing through it, but certainly not showing strength either. The stock is also sitting at about 16% of the 20-hour range, which suggests it is nearer support than resistance. That usually leaves the market vulnerable to either a relief bounce or another leg lower if support gives way.
A squeeze is building, but direction has not been chosen.
That is the key tension in the chart.
Oscillators & Momentum
The momentum picture is mixed, and that is important because mixed momentum inside a downtrend often means rallies can fade quickly. The RSI at 41.0 is neutral, not oversold enough to shout capitulation and not strong enough to suggest a durable recovery. The Stochastic %K at 26.2 and %D at 16.3 also sit in neutral territory, with the fast line above the signal line but still low enough to indicate the stock has not rebuilt real upward momentum. In other words, the oscillators are not bearish to the point of panic, but they are also not giving a clean bullish reversal signal.
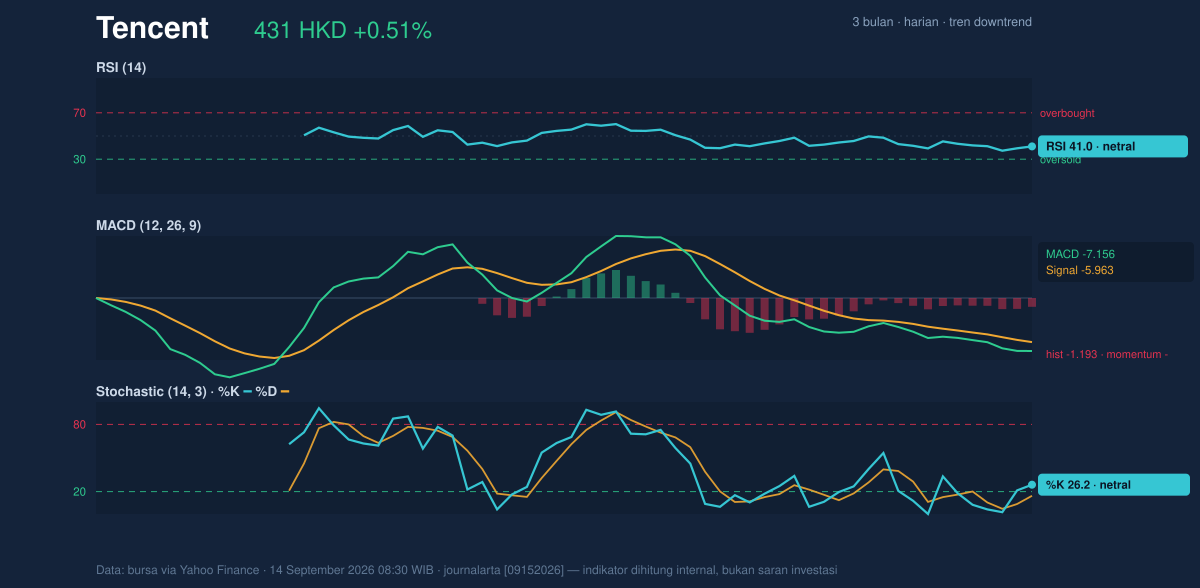
The more telling signal comes from MACD. Tencent’s MACD at -7.156 remains below its signal line at -5.963, and the histogram at -1.193 shows momentum is still negative. For readers less familiar with the term, MACD is a trend-following indicator: when it stays below the signal line, it suggests downside pressure is still leading. The histogram being negative means that pressure has not yet fully eased. So while the oscillators are not screaming oversold, they are also not confirming a strong rebound. That combination usually supports a cautious stance.
Volatility & Volume
Volatility is present, but not extreme. Tencent’s ATR(14) at 9.74, equal to 2.3% of price, says the stock is moving enough to matter without the kind of wild swings that typically mark panic. More interesting is the Bollinger setup: the band width is 7.8%, and it is narrowing in a squeeze. A squeeze often precedes a larger move because the market has been coiling into a tighter range. The challenge is that squeezes do not tell you direction; they only tell you that the next decisive break could be sharper than the recent day-to-day drift.
Volume does not yet validate a stronger move. Last session’s volume was 11,363,985, well below the 20-day average of 18,602,288, or 0.6x normal. That matters because price gains on weak participation are often fragile. The OBV is falling, which means on-balance volume is still pointing to net distribution rather than accumulation. In simple terms, fewer shares are changing hands on the upside, and the broader volume trend is not yet backing a sustained recovery.
The market is coiling, but conviction is thin.
Key Levels & Scenarios
The most important downside marker is the 425.60 support. That level sits just above the lower Bollinger band at 424.26, so the two together form a practical floor area. If that zone fails, the stock would likely be testing the lower end of the recent range more directly, with the 3-month low at 411.00 becoming the next reference point. On the upside, the first real hurdle is the 441.46 SMA20, followed by the 457.00 resistance and then the 458.66 upper Bollinger band. A move through that cluster would matter because it would show the stock has reclaimed its short-term average and is pushing back into the upper part of the range.
If price holds above support and volume improves, the chart could attempt a rebound toward the 20-day average. If it slips below support, the downtrend likely reasserts itself. Those are the two lines that matter most here.
Technical Verdict: HOLD (wait & see)
HOLD (wait & see) fits the current setup because the stock is still in a downtrend, but it is also trading near support and near the lower Bollinger band, where a bounce is possible.
- MACD remains negative, showing downside momentum is still in place.
- Price is below the SMA20 and SMA50, so the broader trend has not turned.
- Bollinger bands are squeezing, which raises the chance of a sharper move, but direction is not confirmed.
- Verdict invalidated if price falls below 425.60, as that would weaken the support floor and increase the risk of a deeper slide.
- Ideal Entry Range: 425.60–430.60 HKD
- Exit Target: 441.46 HKD, then 457.00 HKD
- Stop Loss protection: below 424.26 HKD or, more conservatively, below 425.60 HKD
For non-traders, this means Tencent is not broken, but it has not yet proven it can climb out of its slump.
“The market is waiting for proof, and right now Tencent has not given it.”
Summary Data Tencent
| Last price | 430.60 HKD |
| Change 1 day / 5 days / 1 month | 0.51% / -1.78% / -3.54% |
| Trend / MA-cross | downtrend / none |
| SMA20 / SMA50 | 441.46 / 455.55 |
| RSI (14) / Stochastic %K | 41.0 / 26.2 |
| Bollinger %B / ATR | 18% / 9.74 |
| Support / Resistance 20 days | 425.60 / 457.00 |
| Data as of | 14 September 2026 08:30 WIB |



