HSBC Momentum Weakens: Stock Gains 0.98% (September 15, 2026)
On September 15, 2026: price 164.90 HKD, trend uptrend, RSI 55.6, support 160.30, resistance 167.60. technical analysis of hsbc stock. HSBC Momentum Weakens —…

HSBC Holdings’ Hong Kong-listed shares rose to 164.90 HKD, up 0.98% on the day, but the price is still sitting inside a narrow band rather than breaking away from it. The stock is above its short- and medium-term trend markers, with the SMA20 at 163.09 and SMA50 at 161.15, which keeps the broader setup constructive. Yet the latest momentum readings are less convincing than the price action: the shares are advancing, but the internal signals are not fully confirming that move.
Trend & Price Action
The chart shows a stock that is holding above its trend lines, which matters because in technical analysis that usually means buyers still have the upper hand. The price above the SMA20 and SMA50 suggests the recent pullback has not damaged the larger uptrend, and the SMA20 slope of 0.41% over 5 days shows the short-term trend is still rising. There is no new MA-cross, so the market is not flashing a fresh bullish acceleration signal; instead, it is drifting upward in an existing trend.
That distinction matters. A rising moving average says the trend is intact, but the absence of a new cross means the move is not being reinforced by a fresh technical trigger.
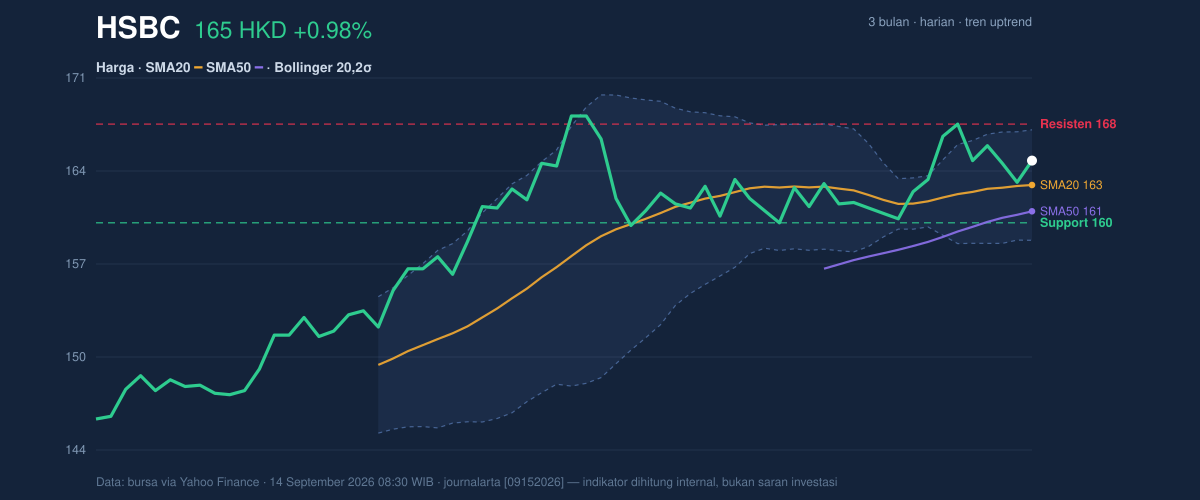
Price is also positioned at 63% of the 20-hour range, which places it in the upper half of the recent band without being stretched to the top. The stock has moved within a 3-month range of 143.40 to 169.70, and the current level leaves it below the upper end of that range, so the market is not yet testing a full breakout zone. The nearest support at 160.30 and resistance at 167.60 frame the near-term battle: HSBC is above support, but still below the ceiling.
Oscillators & Momentum
The momentum picture is more mixed, which is often what keeps a trend from becoming a clean breakout. The RSI at 55.6 is neutral, meaning the stock is neither overbought nor oversold. In plain language, that suggests there is room for further upside, but no strong momentum thrust yet. The Stochastic %K at 67.0 and %D at 60.4 also sit in neutral territory, showing the stock has recovered from weakness but has not entered an overheated condition.
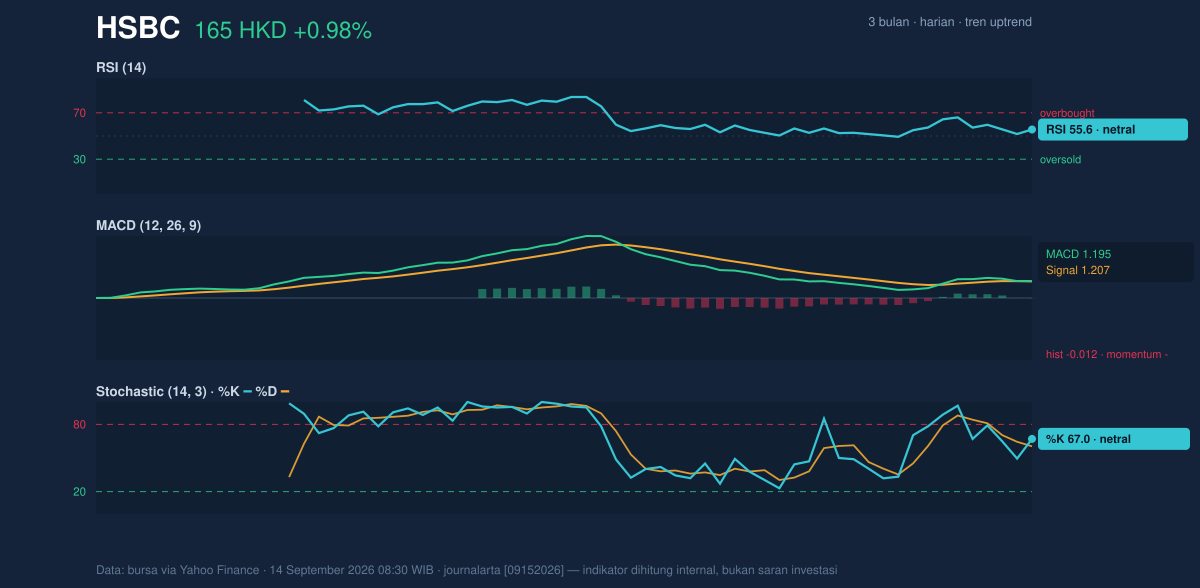
The more important signal is the MACD histogram at -0.012, with MACD 1.195 below signal 1.207. That is a mild negative divergence: price is holding up, but the MACD line is still a touch under its signal line, which means upward momentum is not yet fully confirmed. For readers, MACD is a trend-following indicator; when it turns negative while price remains firm, it often means the move is still alive but losing some push.
So the message from oscillators is not bearish, but cautious. The stock is rising on reasonable footing, yet the momentum engine is not firing at full strength.
Volatility & Volume
Volatility is subdued. The ATR(14) at 2.31, or 1.4% of price, points to relatively low day-to-day movement. That usually means traders are waiting for a catalyst rather than chasing a large swing. The Bollinger Bands reinforce that view: the upper band is 167.18, the middle band is 163.09, and the lower band is 159.01. With %B at 72%, the stock is trading in the upper part of its band, but not at the extreme edge.
More importantly, the band width of 5.0% is described as a squeeze. A squeeze means volatility has contracted, and that often precedes a larger move in either direction. In other words, the stock is being compressed, and compressed prices do not stay quiet forever.
Volume, however, is not yet validating a breakout. The latest turnover of 6,722,791 shares is only 0.7x normal versus the 20-hour average of 9,942,668. That is a sign that the latest rise has not been powered by broad participation. Still, OBV is rising, which is constructive because on-balance volume tracks whether money flow is accumulating over time. Put simply, the tape says buyers are still there, even if they are not showing up in force on the latest session.
Key Levels & Scenarios
The setup is now centered on a tight range. On the upside, 167.18 is the Bollinger upper band and 167.60 is the nearest resistance; together they define the first test zone. A move through that area would suggest the squeeze is resolving upward and that HSBC is trying to challenge its 3-month high of 169.70. On the downside, 163.09 is the SMA20 and middle Bollinger band, making it an important pivot. Below that, 160.30 is the next support, and a break there would weaken the current uptrend structure.
The signal is simple: above the middle band, the stock keeps its constructive bias; below support, the short-term trend starts to lose credibility.
HSBC is technically constructive but not yet decisively strong, because price is above trend support while momentum remains only neutral-to-soft.
Technical Verdict: HOLD (wait & see)
HOLD (wait & see)
- Price is above SMA20 and SMA50, which keeps the trend positive.
- MACD is slightly negative, so momentum has not fully confirmed the price rise.
- Bollinger Bands are in a squeeze, which means a larger move may be coming, but direction is not yet clear.
Verdict invalidated if price falls below 160.30.
- Ideal Entry Range: 163.09 to 160.30
- Exit Target: 167.18 to 167.60
- Stop Loss protection: below 159.01
In plain English: HSBC is holding up, but the chart is still waiting for proof that the next move has real force.
The latest 20-hour support is 160.30 and resistance is 167.60.
Summary Data HSBC
| Last price | 164.90 HKD |
| Change 1 day / 5 days / 1 month | 0.98% / -1.61% / 0.86% |
| Trend / MA-cross | uptrend / none |
| SMA20 / SMA50 | 163.09 / 161.15 |
| RSI (14) / Stochastic %K | 55.6 / 67.0 |
| Bollinger %B / ATR | 72% / 2.31 |
| Support / Resistance 20 days | 160.30 / 167.60 |
| Data as of | 14 September 2026 08:30 WIB |



