DBS Stock Gains 0.86% Today, Testing Key Resistance
On September 15, 2026: price 77.66 SGD, trend uptrend, RSI 59.0, support 75.56, resistance 78.65. technical analysis of dbs stock. DBS Stock Gains — full…

DBS Group’s shares were last quoted at 77.66 SGD on SGX on 14 September 2026, up 0.86% from the previous close of 77.00. The move keeps the stock above its short- and medium-term trend lines, but the message from the chart is less about a clean breakout and more about a market pausing near the top of its recent range. As shown in the chart, DBS is trading in an uptrend, yet the latest session also shows a market that is advancing without strong participation.
Trend & Price Action
The key structural point is that DBS remains above its SMA20 at 76.88 and well above its SMA50 at 74.72, which tells traders the broader tape is still constructive. Price sitting above both moving averages usually means recent buyers have had the upper hand, and the fact that the SMA20 slope is rising reinforces that the short-term trend is still pointing higher. There is no fresh MA-cross, so this is not a new momentum regime shift; it is more a continuation pattern than a fresh signal.
What matters now is where price sits inside the range. DBS is trading at 77.66, above the Bollinger midline and close to the upper half of the recent band structure, while the 20-hour support at 75.56 and resistance at 78.65 frame the current battle. The stock is at roughly 68% of its recent range, which means it is leaning toward the upper end but has not yet forced a decisive escape. That positioning often leaves room for either a push toward resistance or a stall if buyers lose urgency.
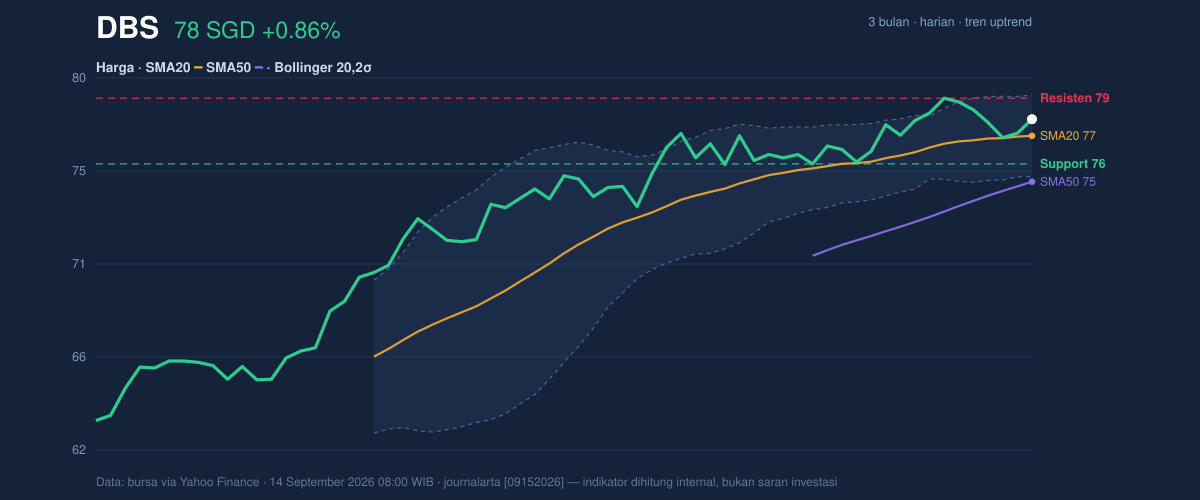
The broader three-month range gives the move context: DBS has traded between 63.08 and 79.05, so the current level is already close to the upper boundary of that span. That proximity matters because markets often become more sensitive near prior highs; even modest selling can slow progress when price is pressing into resistance.
Oscillators & Momentum
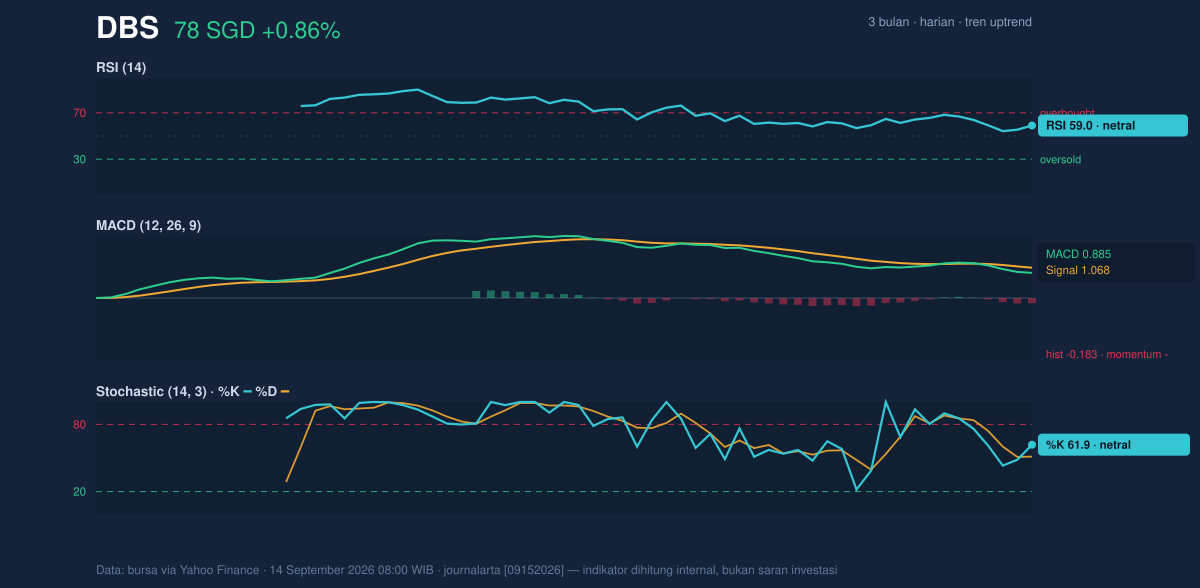
Momentum is mixed rather than decisive. The RSI at 59.0 is neutral, which says the stock is neither overbought nor oversold. In plain language, that is not a warning sign by itself; it simply means the rally has room to continue, but it does not yet have the kind of stretched momentum that often precedes a breakout burst. The Stochastic %K at 61.9 and %D at 51.2 also sit in neutral territory, showing short-term momentum is positive but not especially forceful.
The more cautious message comes from MACD. The MACD at 0.885 is below the signal line at 1.068, with a histogram of -0.183. That negative histogram means the faster trend has slipped behind the slower trend, a sign that upward momentum is fading even while price remains above key averages. It is not a full reversal call on its own, but it does explain why the stock can hold its trend and still feel hesitant. The chart is saying: the trend is intact, but the engine is not accelerating.
Volatility & Volume
Volatility is subdued. DBS’s ATR(14) at 0.86, equal to 1.1% of price, points to a low-volatility environment. Combined with Bollinger bandwidth of 5.0%, which is described as a squeeze, this suggests the stock is coiling rather than trending hard in the immediate term. A squeeze does not predict direction, but it often precedes a larger move once price leaves the band structure. In practical terms, the market is compressing energy.
The Bollinger position also matters: price is at %B 70%, meaning it is above the midpoint and leaning toward the upper band at 78.80. That is constructive, but not enough to declare a breakout. The stock is close to resistance, yet the band is still narrow, so a move through the upper boundary could matter more than usual.
Volume, however, is not confirming enthusiasm. Last volume was 2,787,100, below the 20-hour average of 3,455,700, or about 0.8x normal. The OBV is falling, which means net volume flow has been weaker even as price has held up. That divergence is important: price can drift higher on limited turnover, but without participation the move is more vulnerable to fading. In other words, the market is climbing, but not many hands are carrying it.
Key Levels & Scenarios
The nearest line in the sand is support at 75.56. If DBS holds above that area, the uptrend remains intact and the chart can continue to work toward the upper band and resistance. A clean push through 78.65 would put the stock into the uppermost part of its recent range and test whether the squeeze resolves into follow-through. Above that, the 78.80 Bollinger upper band and the 79.05 three-month high are the obvious reference points.
If the stock fails to hold 75.56, the tone changes quickly. That would place price back into the lower half of the range and weaken the case that the recent rise is being supported by trend. The lower Bollinger band at 74.96 then becomes the next technical cushion, but a loss of the first support would be a clear sign that the current advance is losing traction.
Technical Verdict: HOLD (wait & see)
- Price is above SMA20 and SMA50, so the broader trend remains positive.
- MACD histogram is negative and OBV is falling, showing momentum and participation are not fully confirming the price.
- Bollinger bands are squeezed, which can precede a sharper move, but direction is not yet confirmed.
Verdict invalidated if price falls below 75.56.
- Ideal Entry Range: 75.56 to 76.88
- Exit Target: 78.65 to 78.80
- Stop Loss protection: below 74.96
For non-traders, this means DBS still looks technically firm, but the chart is asking for proof before the next move becomes convincing.
“The market is holding its shape, but it has not yet shown its hand.”
Summary Data DBS
| Last price | 77.66 SGD |
| Change 1 day / 5 days / 1 month | 0.86% / -1.03% / 1.01% |
| Trend / MA-cross | uptrend / none |
| SMA20 / SMA50 | 76.88 / 74.72 |
| RSI (14) / Stochastic %K | 59.0 / 61.9 |
| Bollinger %B / ATR | 70% / 0.86 |
| Support / Resistance 20 days | 75.56 / 78.65 |
| Data as of | 14 September 2026 08:00 WIB |


